Page 1 of 1
1. The population of a city is given as ordered pairs showing the year and the population for specific recorded years: 2
Posted: Wed May 11, 2022 7:58 am
by answerhappygod
- 1 The Population Of A City Is Given As Ordered Pairs Showing The Year And The Population For Specific Recorded Years 2 1 (43.16 KiB) Viewed 41 times
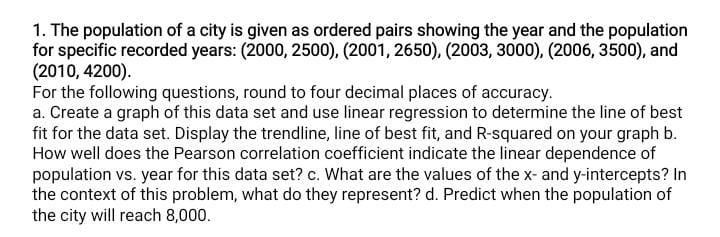
1. The population of a city is given as ordered pairs showing the year and the population for specific recorded years: 2000, 2500), (2001, 2650), (2003, 3000). (2006, 3500), and (2010, 4200). For the following questions, round to four decimal places of accuracy. a. Create a graph of this data set and use linear regression to determine the line of best fit for the data set. Display the trendline, line of best fit, and R-squared on your graph b. How well does the Pearson correlation coefficient indicate the linear dependence of population vs. year for this data set? c. What are the values of the x- and y-intercepts? In the context of this problem, what do they represent? d. Predict when the population of the city will reach 8,000.