Page 1 of 1
In an attempt to develop a model of wine quality as judged by wine experts, data on alcohol content and wine quality was
Posted: Wed May 11, 2022 7:10 am
by answerhappygod
- In An Attempt To Develop A Model Of Wine Quality As Judged By Wine Experts Data On Alcohol Content And Wine Quality Was 1 (51.62 KiB) Viewed 25 times
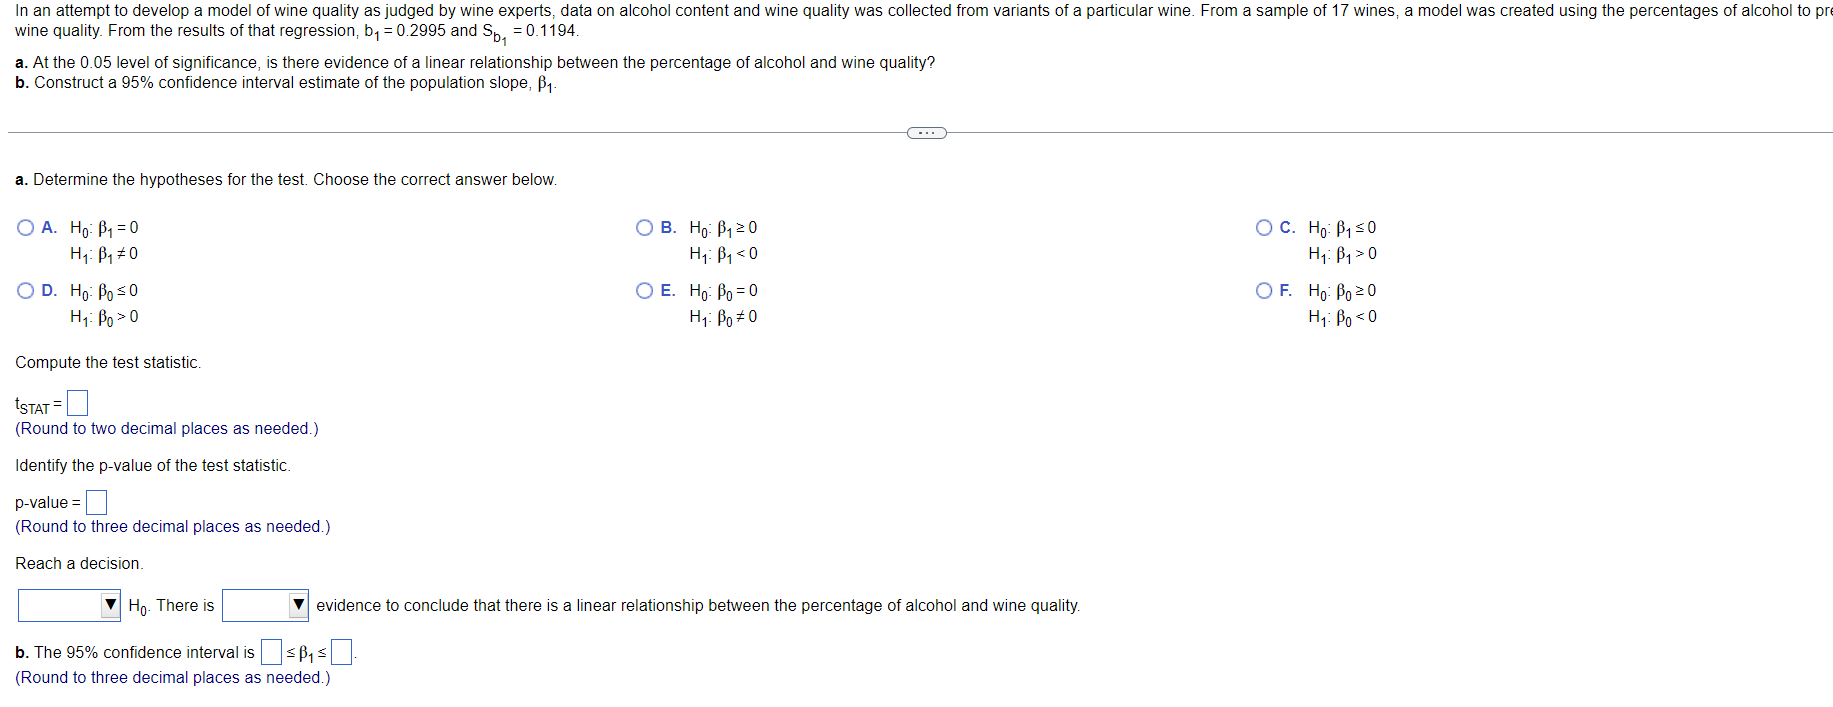
In an attempt to develop a model of wine quality as judged by wine experts, data on alcohol content and wine quality was collected from variants of a particular wine. From a sample of 17 wines, a model was created using the percentages of alcohol to pre wine quality. From the results of that regression, b1 = 0.2995 and So, = 0.1194. a. At the 0.05 level of significance, is there evidence of a linear relationship between the percentage of alcohol and wine quality? b. Construct a 95% confidence interval estimate of the population slope, B1 ... a. Determine the hypotheses for the test. Choose the correct answer below. O A. Ho: B2 = 0 Hi: B, 70 O B. Ho: B120 Hi: B, <0 O E. Ho: Bo = 0 Hi: Bo70 OC. Ho: B230 H: B,> 0 OF. Ho: Bo 20 Hi: Bo<0 OD. Ho: Bo so Hi: Bo> 0 Compute the test statistic. STAT=0 (Round to two decimal places as needed.) Identify the p-value of the test statistic. p-value = (Round to three decimal places as needed.) Reach a decision. V Ho. There is evidence to conclude that there is a linear relationship between the percentage of alcohol and wine quality. b. The 95% confidence interval is =B=0 (Round to three decimal places as needed.)