Page 1 of 1
Table 1: Descriptive statistics of the mortality rates by suicide of women in 2015-2020 Year Mean range Minimum Maximum
Posted: Wed May 11, 2022 7:07 am
by answerhappygod
- Table 1 Descriptive Statistics Of The Mortality Rates By Suicide Of Women In 2015 2020 Year Mean Range Minimum Maximum 1 (76.34 KiB) Viewed 26 times
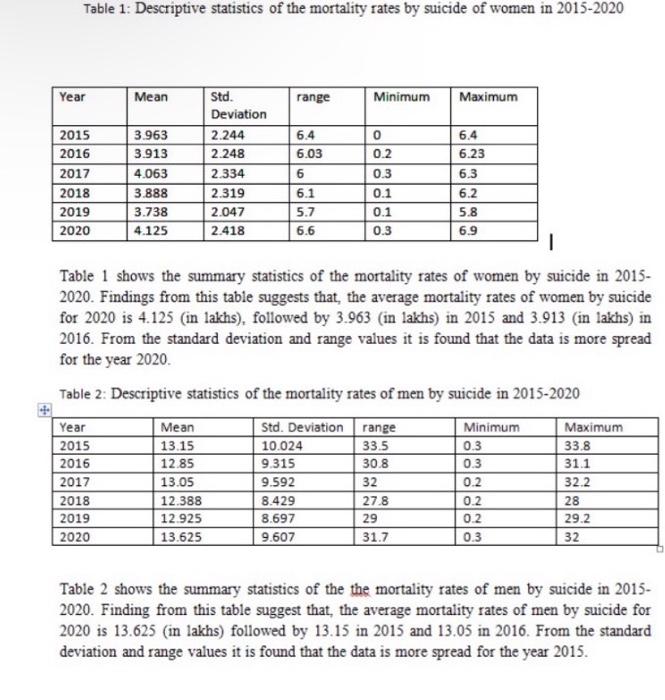
Table 1: Descriptive statistics of the mortality rates by suicide of women in 2015-2020 Year Mean range Minimum Maximum 2015 2016 2017 2018 2019 2020 3.963 3.913 4.063 3.888 3.738 4.125 Std. Deviation 2.244 2.248 2.334 2.319 2.047 2.418 6.4 6.03 6 6.1 5.7 6.6 0 0.2 0.3 0.1 0.1 6.4 6.23 6.3 6.2. 5.8 6.9 bon 0.3 Table 1 shows the summary statistics of the mortality rates of women by suicide in 2015- 2020. Findings from this table suggests that, the average mortality rates of women by suicide for 2020 is 4.125 (in lakhs), followed by 3.963 (in lakhs) in 2015 and 3.913 (in lakhs) in 2016. From the standard deviation and range values it is found that the data is more spread for the year 2020 Table 2: Descriptive statistics of the mortality rates of men by suicide in 2015-2020 Year Mean Std. Deviation range Minimum Maximum 2015 13.15 33.5 33.8 12.85 2017 13.05 9.592 0.2 32.2 2018 8.429 2019 12.925 8.697 2020 13.625 9.607 31.7 0.3 32 10.024 9.315 0.3 0.3 2016 31.1 30.8 32 27.8 29 12.388 0.2 0.2 28 29.2 Table 2 shows the summary statistics of the the mortality rates of men by suicide in 2015- 2020. Finding from this table suggest that, the average mortality rates of men by suicide for 2020 is 13.625 (in lakhs) followed by 13.15 in 2015 and 13.05 in 2016. From the standard deviation and range values it is found that the data is more spread for the year 2015.