Page 1 of 1
Question 1 The temperature measurements taken at the observatory over the last century revealed a systematic trend of in
Posted: Wed May 11, 2022 7:03 am
by answerhappygod
- Question 1 The Temperature Measurements Taken At The Observatory Over The Last Century Revealed A Systematic Trend Of In 1 (40.02 KiB) Viewed 38 times
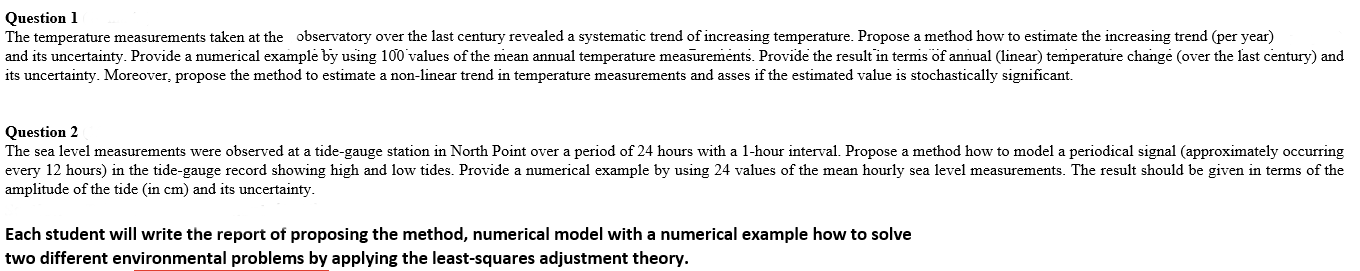
Question 1 The temperature measurements taken at the observatory over the last century revealed a systematic trend of increasing temperature. Propose a method how to estimate the increasing trend (per year) and its uncertainty. Provide a numerical example by using 100 values of the mean annual temperature measurements. Provide the result in terms of annual (linear) temperature change (over the last century) and its uncertainty. Moreover, propose the method to estimate a non-linear trend in temperature measurements and asses if the estimated value is stochastically significant. Question 2 The sea level measurements were observed at a tide-gauge station in North Point over a period of 24 hours with a 1-hour interval. Propose a method how to model a periodical signal (approximately occurring every 12 hours) in the tide-gauge record showing high and low tides. Provide a numerical example by using 24 values of the mean hourly sea level measurements. The result should be given in terms of the amplitude of the tide (in cm) and its uncertainty. Each student will write the report of proposing the method, numerical model with a numerical example how to solve two different environmental problems by applying the least-squares adjustment theory.