Page 1 of 1
Hackney's population of eels is described by the following model. The density of eels in yeart is given by Xt, and X4+1
Posted: Wed May 11, 2022 6:46 am
by answerhappygod
- Hackney S Population Of Eels Is Described By The Following Model The Density Of Eels In Yeart Is Given By Xt And X4 1 1 (30.62 KiB) Viewed 36 times
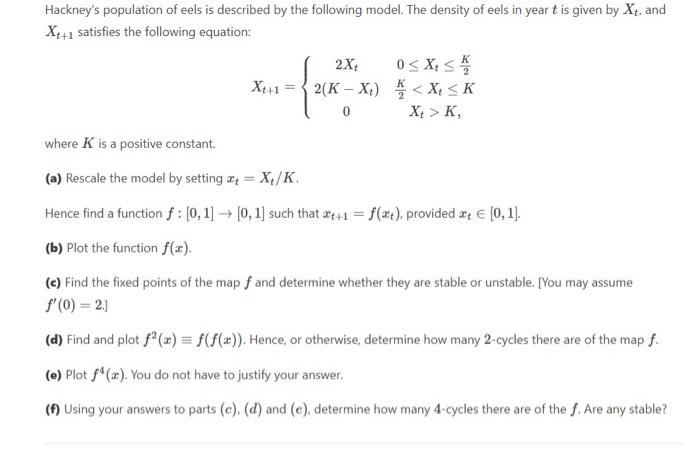
Hackney's population of eels is described by the following model. The density of eels in yeart is given by Xt, and X4+1 satisfies the following equation: 2X 0<Xi sa X:+1 = 2(K - Xi) < X SK Xt >K where K is a positive constant (a) Rescale the model by setting at = X/K. Hence find a function f : [0,1] [0, 1] such that +1 = f(x+), provided 24 € (0,1]. 0 (b) Plot the function f(x). (c) Find the fixed points of the map f and determine whether they are stable or unstable. [You may assume f(0) = 2.1 (d) Find and plot f(x) = f(f(x)). Hence, or otherwise, determine how many 2-cycles there are of the map f. (e) Plot f*(x). You do not have to justify your answer. (f) Using your answers to parts (c), (d) and (e), determine how many 4-cycles there are of the f. Are any stable?