Page 1 of 1
2. By Hand: The National Center for Health Statistics (NCHS) provided data on the distribution of weight (in categories)
Posted: Mon Nov 15, 2021 9:53 am
by answerhappygod
- 2 By Hand The National Center For Health Statistics Nchs Provided Data On The Distribution Of Weight In Categories 1 (44.7 KiB) Viewed 141 times
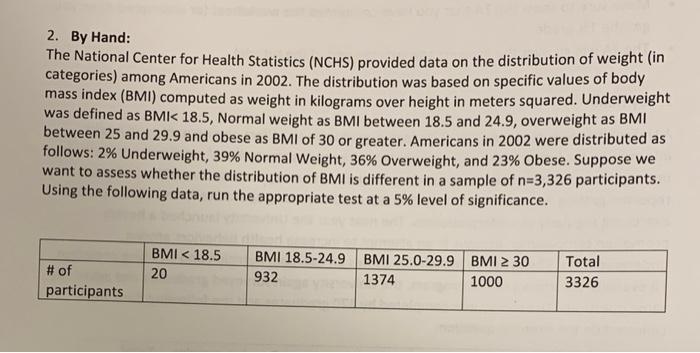
2. By Hand: The National Center for Health Statistics (NCHS) provided data on the distribution of weight (in categories) among Americans in 2002. The distribution was based on specific values of body mass index (BMI) computed as weight in kilograms over height in meters squared. Underweight was defined as BMI< 18.5, Normal weight as BMI between 18.5 and 24.9, overweight as BMI between 25 and 29.9 and obese as BMI of 30 or greater. Americans in 2002 were distributed as follows: 2% Underweight, 39% Normal Weight, 36% Overweight, and 23% Obese. Suppose we want to assess whether the distribution of BMI is different in a sample of n=3,326 participants. Using the following data, run the appropriate test at a 5% level of significance. BMI < 18.5 20 # of participants BMI 18.5-24.9 BMI 25.0-29.9 BMI 2 30 932 1374 1000 Total 3326