Page 1 of 1
b6 A sample of 248 people was randomly chosen and were individually identified as to their gender and political affiliat
Posted: Wed May 11, 2022 6:22 am
by answerhappygod
- B6 A Sample Of 248 People Was Randomly Chosen And Were Individually Identified As To Their Gender And Political Affiliat 1 (71.35 KiB) Viewed 34 times
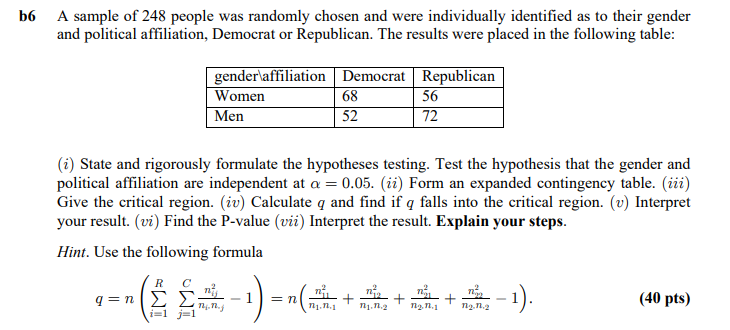
b6 A sample of 248 people was randomly chosen and were individually identified as to their gender and political affiliation, Democrat or Republican. The results were placed in the following table: gender affiliation Democrat Republican Women 68 56 Men 52 72 (i) State and rigorously formulate the hypotheses testing. Test the hypothesis that the gender and political affiliation are independent at a = 0.05. (ii) Form an expanded contingency table. (ii) Give the critical region. (iv) Calculate q and find if q falls into the critical region. (v) Interpret your result. (vi) Find the P-value (vii) Interpret the result. Explain your steps. Hint. Use the following formula R q (Σ Σ -=-( &#--)--(*+*+*+*-1). ΣΗ =n (40 pts) . n. =1