Page 1 of 1
Option 3: Search and collect proportion data for more than two samples (10 to 30 observations). Perform multiple sample
Posted: Wed May 11, 2022 6:20 am
by answerhappygod
- Option 3 Search And Collect Proportion Data For More Than Two Samples 10 To 30 Observations Perform Multiple Sample 1 (163.21 KiB) Viewed 22 times
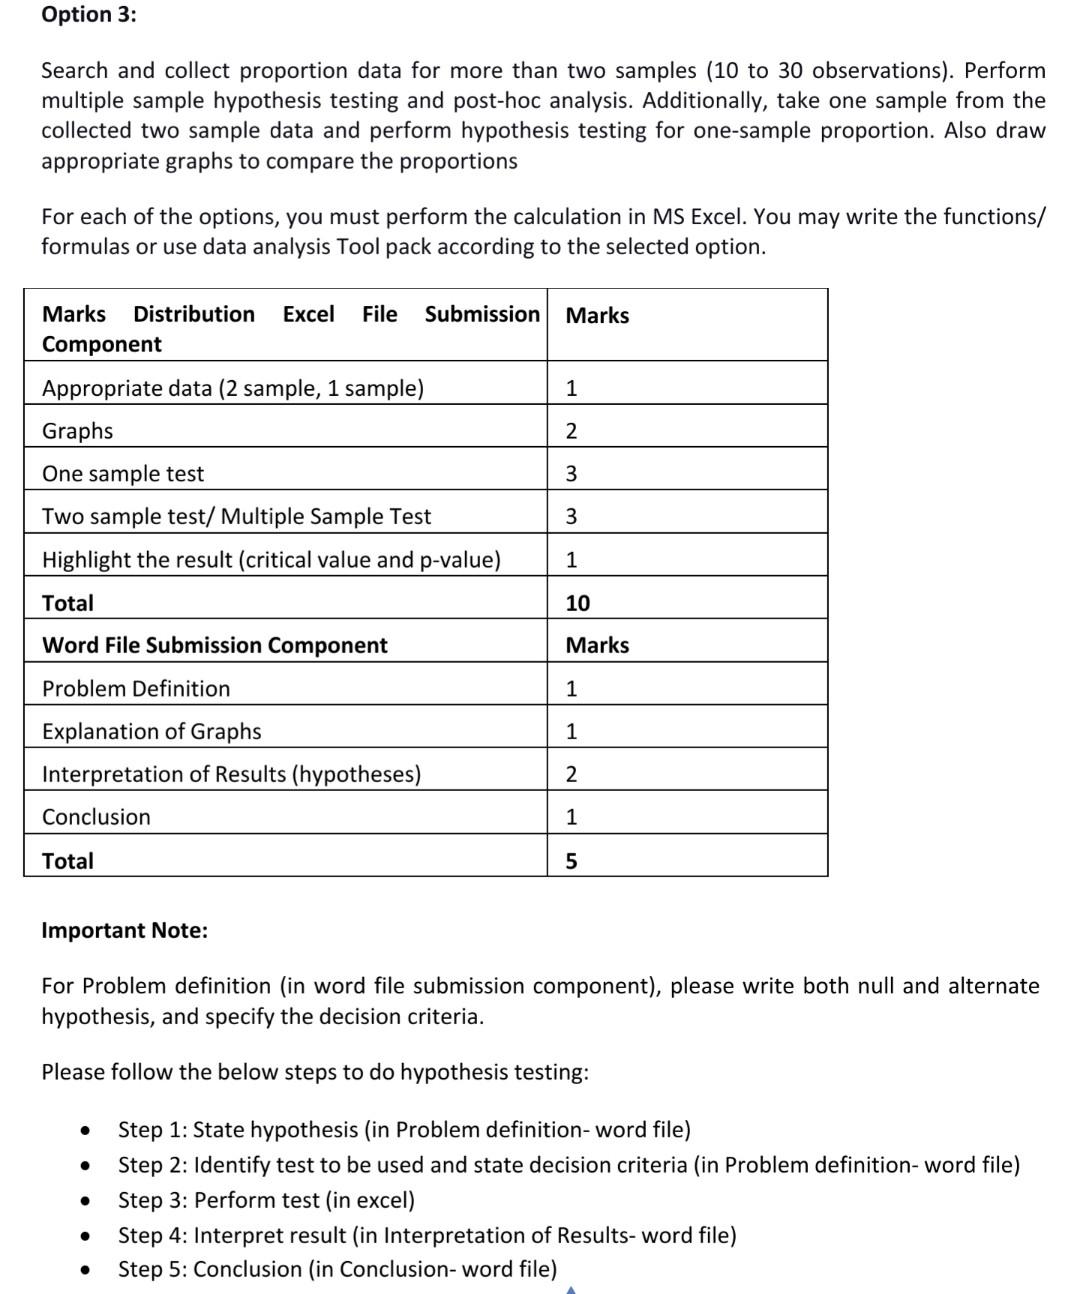
Option 3: Search and collect proportion data for more than two samples (10 to 30 observations). Perform multiple sample hypothesis testing and post-hoc analysis. Additionally, take one sample from the collected two sample data and perform hypothesis testing for one-sample proportion. Also draw appropriate graphs to compare the proportions For each of the options, you must perform the calculation in MS Excel. You may write the functions/ formulas or use data analysis Tool pack according to the selected option. Excel File Submission Marks Marks Distribution Component 1 Appropriate data (2 sample, 1 sample) Graphs 2 One sample test 3 3 Two sample test/ Multiple Sample Test Highlight the result (critical value and p-value) 1 Total 10 Word File Submission Component Marks Problem Definition 1 1 Explanation of Graphs Interpretation of Results (hypotheses) 2 Conclusion 1 Total 5 Important Note: For Problem definition (in word file submission component), please write both null and alternate hypothesis, and specify the decision criteria. Please follow the below steps to do hypothesis testing: . . Step 1: State hypothesis (in Problem definition-word file) Step 2: Identify test to be used and state decision criteria (in Problem definition-word file) Step 3: Perform test (in excel) Step 4: Interpret result (in Interpretation of Results-word file) Step 5: Conclusion (in Conclusion- word file) .