Page 1 of 1
The following graph shows the annual number of housing starts in a country during 2000-2008 together with the given quad
Posted: Tue May 10, 2022 7:24 pm
by answerhappygod
- The Following Graph Shows The Annual Number Of Housing Starts In A Country During 2000 2008 Together With The Given Quad 1 (44.2 KiB) Viewed 23 times
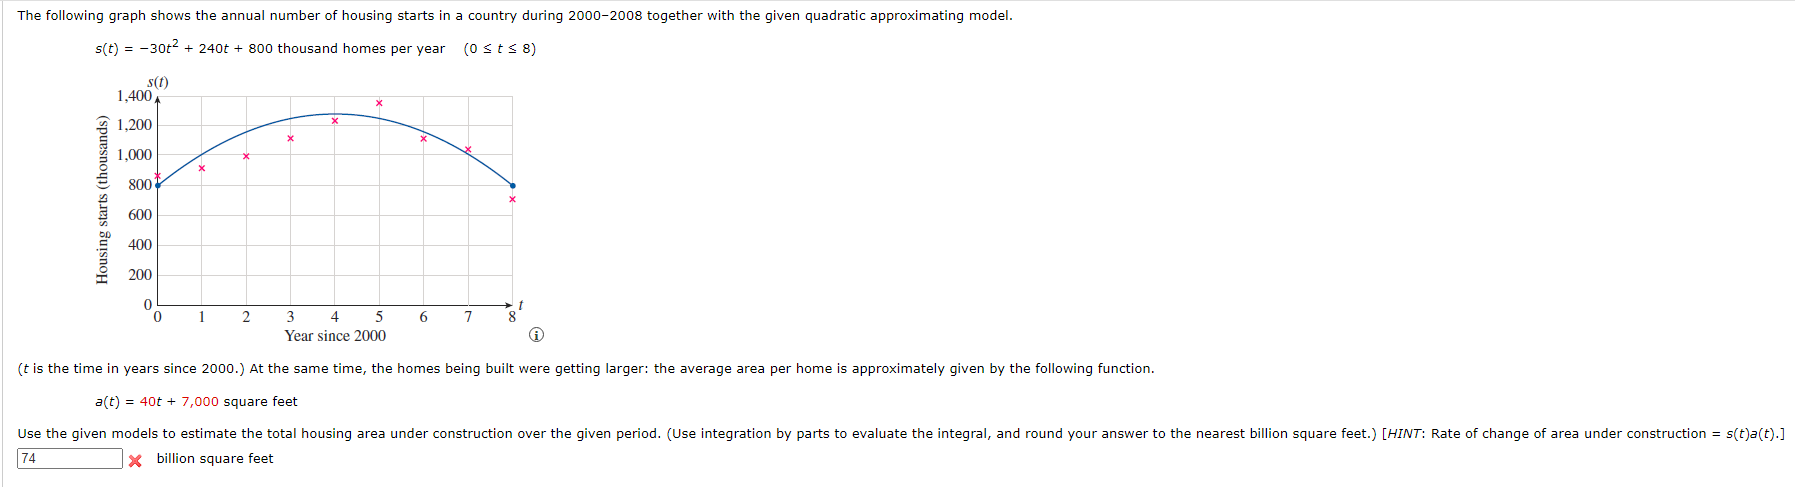
The following graph shows the annual number of housing starts in a country during 2000-2008 together with the given quadratic approximating model. s(t) = -302 + 240t + 800 thousand homes per year (Osts 8) s(t) 1,400 1,200 X 1,000 X 800 Housing starts (thousands) 600 400 200 0 0 1 2 6 7 8 3 4 5 Year since 2000 (t is the time in years since 2000.) At the same time, the homes being built were getting larger: the average area per home is approximately given by the following function. a(t) = 40t + 7,000 square feet Use the given models to estimate the total housing area under construction over the given period. (Use integration by parts to evaluate the integral, and round your answer to the nearest billion square feet.) [HINT: Rate of change of area under construction = s(t)a(t).] 74 x billion square feet