Page 1 of 1
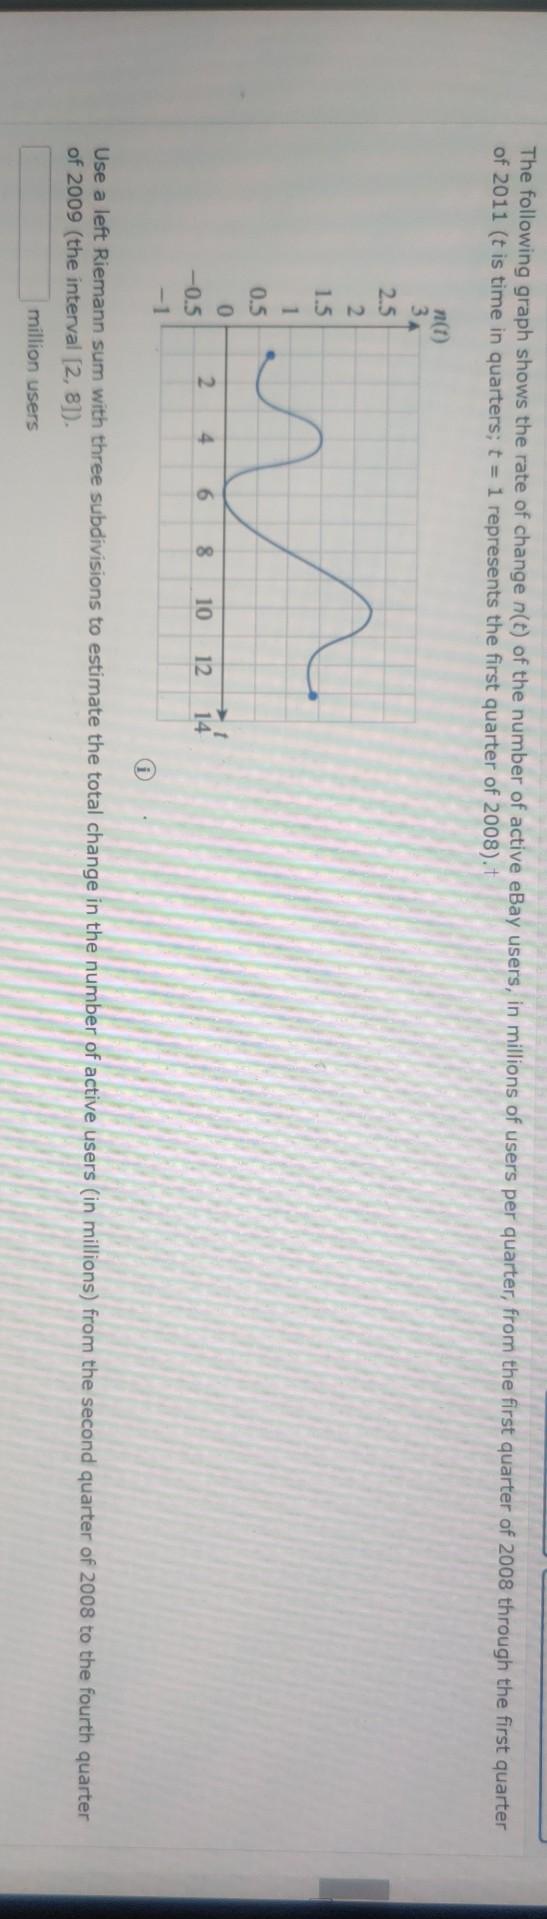
The following graph shows the rate of change n(t) of the number of active eBay users, in millions of users per quarter,
Posted: Tue May 10, 2022 12:05 pm
by answerhappygod
- The Following Graph Shows The Rate Of Change N T Of The Number Of Active Ebay Users In Millions Of Users Per Quarter 1 (86.13 KiB) Viewed 28 times
The following graph shows the rate of change n(t) of the number of active eBay users, in millions of users per quarter, from the first quarter of 2008 through the first quarter of 2011 (t is time in quarters; t = 1 represents the first quarter of 2008). w n(1) 3A 2.5 2. 1.5 1 0.5 0 -0.5 -1 2. 4 6 00 10 12 14 Use a left Riemann sum with three subdivisions to estimate the total change in the number of active users (in millions) from the second quarter of 2008 to the fourth quarter of 2009 (the interval [2, 8]). million users