Page 1 of 1
Use the method of orthogonal projections find the best fit parabola y = Ĉ + Ônt + Êt? for the given data. Then, draw a c
Posted: Tue May 10, 2022 8:47 am
by answerhappygod
- Use The Method Of Orthogonal Projections Find The Best Fit Parabola Y C Ont Et For The Given Data Then Draw A C 1 (32.2 KiB) Viewed 32 times
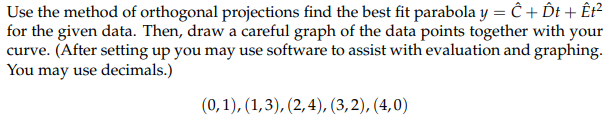
Use the method of orthogonal projections find the best fit parabola y = Ĉ + Ônt + Êt? for the given data. Then, draw a careful graph of the data points together with your curve. (After setting up you may use software to assist with evaluation and graphing. You may use decimals.) (0,1),(1,3), (2,4),(3,2), (4,0)