Page 1 of 1
Part-A: 95 89 14 Covid-19 Situation Report, Table 1A, represents the approximated numbers of confirmed Covid 19 cases (i
Posted: Sun Oct 03, 2021 3:49 pm
by answerhappygod
- Part A 95 89 14 Covid 19 Situation Report Table 1a Represents The Approximated Numbers Of Confirmed Covid 19 Cases I 1 (91.48 KiB) Viewed 225 times
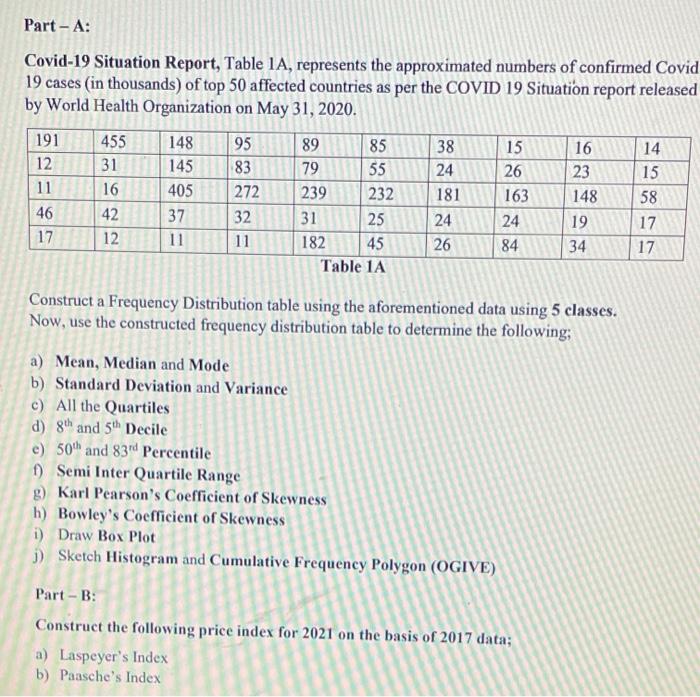
Part-A: 95 89 14 Covid-19 Situation Report, Table 1A, represents the approximated numbers of confirmed Covid 19 cases (in thousands) of top 50 affected countries as per the COVID 19 Situation report released by World Health Organization on May 31, 2020. 191 455 148 85 38 15 16 12 145 83 79 55 24 26 23 15 11 16 405 272 239 232 181 163 148 58 46 42 37 32 31 25 24 24 19 17 17 12 11 11 182 45 26 84 34 17 Table 1A 31 Construct a Frequency Distribution table using the aforementioned data using 5 classes. Now, use the constructed frequency distribution table to determine the following: a) Mean, Median and Mode b) Standard Deviation and Variance c) All the Quartiles d) gth and 5th Decile e) 50th and 83d Percentile f) Semi Inter Quartile Range g) Karl Pearson's Coefficient of Skewness h) Bowley's Coefficient of Skewness i) Draw Box Plot 1) Sketch Histogram and Cumulative Frequency Polygon (ОGIVE) Part - B: Construct the following price index for 2021 on the basis of 2017 data; a) Laspeyer's Index b) Paasche's Index