Page 1 of 1
The following data represent the amount of soft drink in a sample of 50 2-liter bottles a. Construct a cumulative percen
Posted: Sun Oct 03, 2021 3:31 pm
by answerhappygod
- The Following Data Represent The Amount Of Soft Drink In A Sample Of 50 2 Liter Bottles A Construct A Cumulative Percen 1 (29.15 KiB) Viewed 185 times
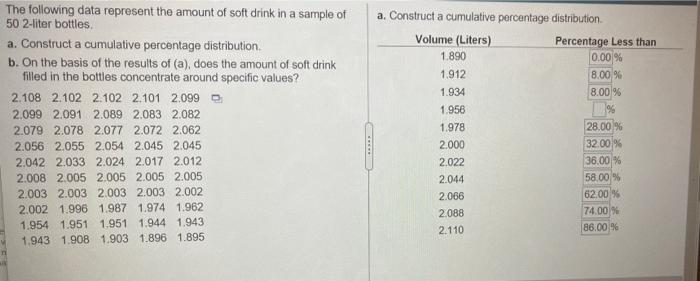
The following data represent the amount of soft drink in a sample of 50 2-liter bottles a. Construct a cumulative percentage distribution b. On the basis of the results of (a), does the amount of soft drink filled in the bottles concentrate around specific values? 2.108 2.102 2.102 2.101 2.099 2.099 2.091 2.089 2.083 2.082 2.079 2.078 2.077 2.072 2.062 2.056 2.055 2.054 2.045 2.045 2.042 2.033 2.024 2.017 2.012 2.008 2.005 2.005 2.005 2.005 2.0032.003 2.003 2.003 2002 2.002 1.996 1.987 1.974 1.962 1.954 1.951 1.951 1.944 1.943 1.943 1.908 1.903 1.896 1.895 a. Construct a cumulative percentage distribution Volume (Liters) Percentage Less than 1.890 0.00 % 1.912 8.00% 1.934 8.00 % 1.956 1.978 28.00% 2.000 32.00% 2.022 36.00% 2.044 58.00% 2.066 62.00% 2.088 74.00% 2.110 86.00%