Page 1 of 1
Question 4. [7 marks] [Chapter 6] A statistics student was interested in investigating the average time it takes to get
Posted: Sun Oct 03, 2021 3:30 pm
by answerhappygod
- Question 4 7 Marks Chapter 6 A Statistics Student Was Interested In Investigating The Average Time It Takes To Get 1 (103.23 KiB) Viewed 134 times
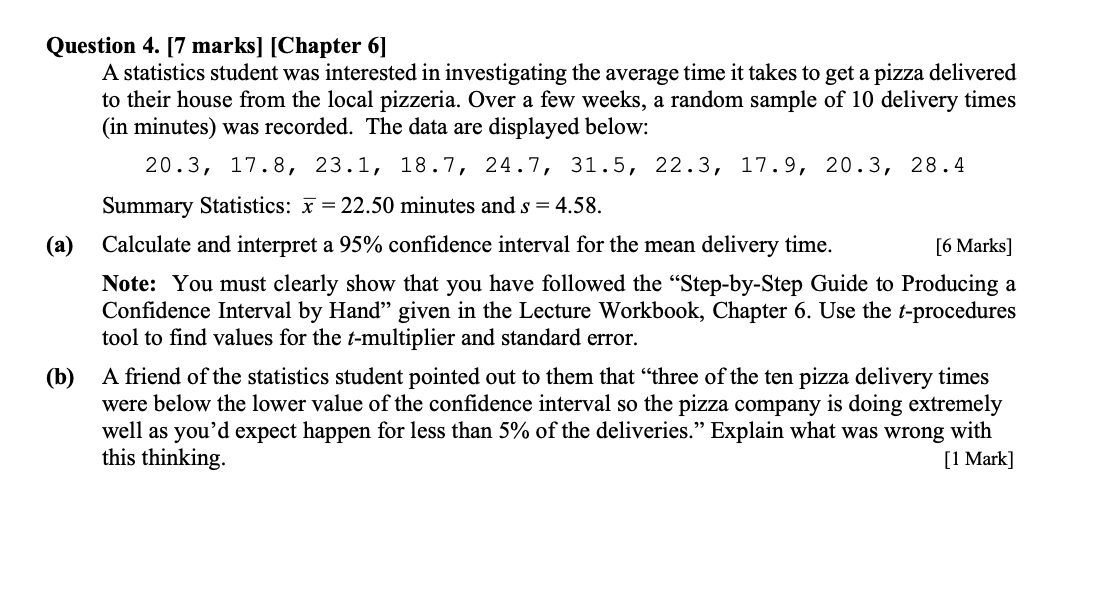
Question 4. [7 marks] [Chapter 6] A statistics student was interested in investigating the average time it takes to get a pizza delivered to their house from the local pizzeria. Over a few weeks, a random sample of 10 delivery times (in minutes) was recorded. The data are displayed below: 20.3, 17.8, 23.1, 18.7, 24.7, 31.5, 22.3, 17.9, 20.3, 28.4 Summary Statistics: X = 22.50 minutes and s = 4.58. (a) Calculate and interpret a 95% confidence interval for the mean delivery time. [6 Marks] Note: You must clearly show that you have followed the “Step-by-Step Guide to Producing a Confidence Interval by Hand” given in the Lecture Workbook, Chapter 6. Use the t-procedures tool to find values for the t-multiplier and standard error. (b) A friend of the statistics student pointed out to them that “three of the ten pizza delivery times were below the lower value of the confidence interval so the pizza company is doing extremely well as you'd expect happen for less than 5% of the deliveries.” Explain what was wrong with this thinking. [1 Mark]