Page 1 of 1
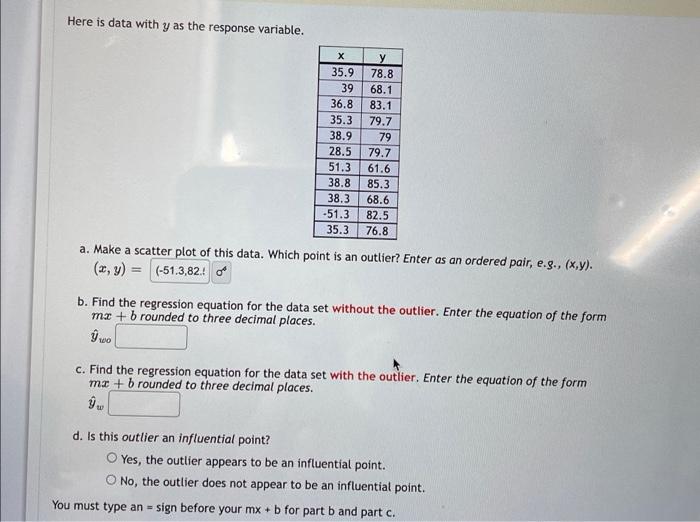
Here is data with y as the response variable. х 35.9 39 36.8 35.3 38.9 28.5 51.3 38.8 38.3 -51.3 35.3 у 78.8 68.1 83.1 7
Posted: Mon May 09, 2022 1:25 pm
by answerhappygod
- 1 (46.73 KiB) Viewed 23 times
Here is data with y as the response variable. х 35.9 39 36.8 35.3 38.9 28.5 51.3 38.8 38.3 -51.3 35.3 у 78.8 68.1 83.1 79.7 79 79.7 61.6 85.3 68.6 82.5 76.8 a. Make a scatter plot of this data. Which point is an outlier? Enter as an ordered pair, e.s., (x,y). (x, y) = (-51.3,82.: b. Find the regression equation for the data set without the outlier. Enter the equation of the form mx + b rounded to three decimal places. c. Find the regression equation for the data set with the outlier. Enter the equation of the form mx + b rounded to three decimal places. d. Is this outlier an influential point? Yes, the outlier appears to be an influential point. No, the outlier does not appear to be an influential point. You must type an = sign before your mx + b for part b and part c.