Page 1 of 1
6. Data on fifth grade test scores for 420 school districts in California are given in the ‘CASchools' data accessed usi
Posted: Sun Oct 03, 2021 3:27 pm
by answerhappygod
- 6 Data On Fifth Grade Test Scores For 420 School Districts In California Are Given In The Caschools Data Accessed Usi 1 (146.19 KiB) Viewed 176 times
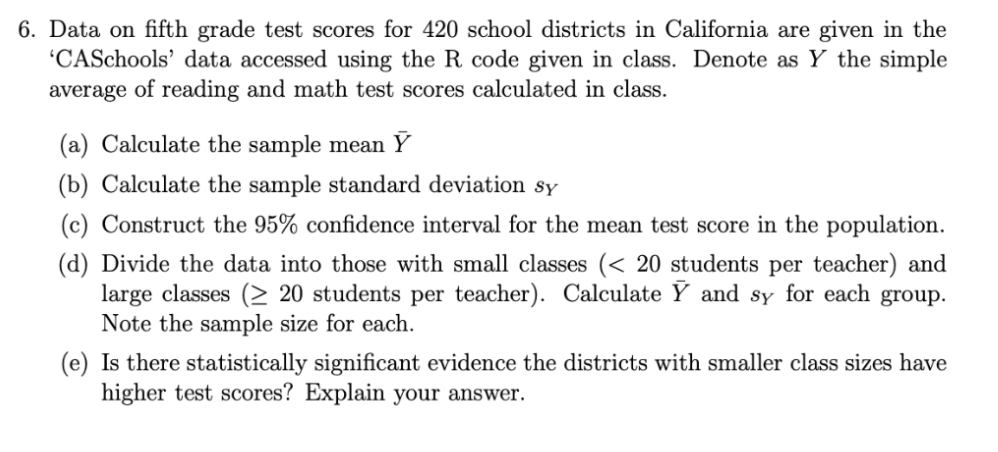
6. Data on fifth grade test scores for 420 school districts in California are given in the ‘CASchools' data accessed using the R code given in class. Denote as Y the simple average of reading and math test scores calculated in class. (a) Calculate the sample mean ✓ (b) Calculate the sample standard deviation sy (c) Construct the 95% confidence interval for the mean test score in the population. (d) Divide the data into those with small classes (< 20 students per teacher) and large classes (> 20 students per teacher). Calculate 7 and sy for each group. Note the sample size for each. (e) Is there statistically significant evidence the districts with smaller class sizes have higher test scores? Explain your answer.