- Instructions A You Should Prepare Your Coursework Report Using Microsoft Word A Pdf Report From Another Program Is Als 1 (207.59 KiB) Viewed 26 times
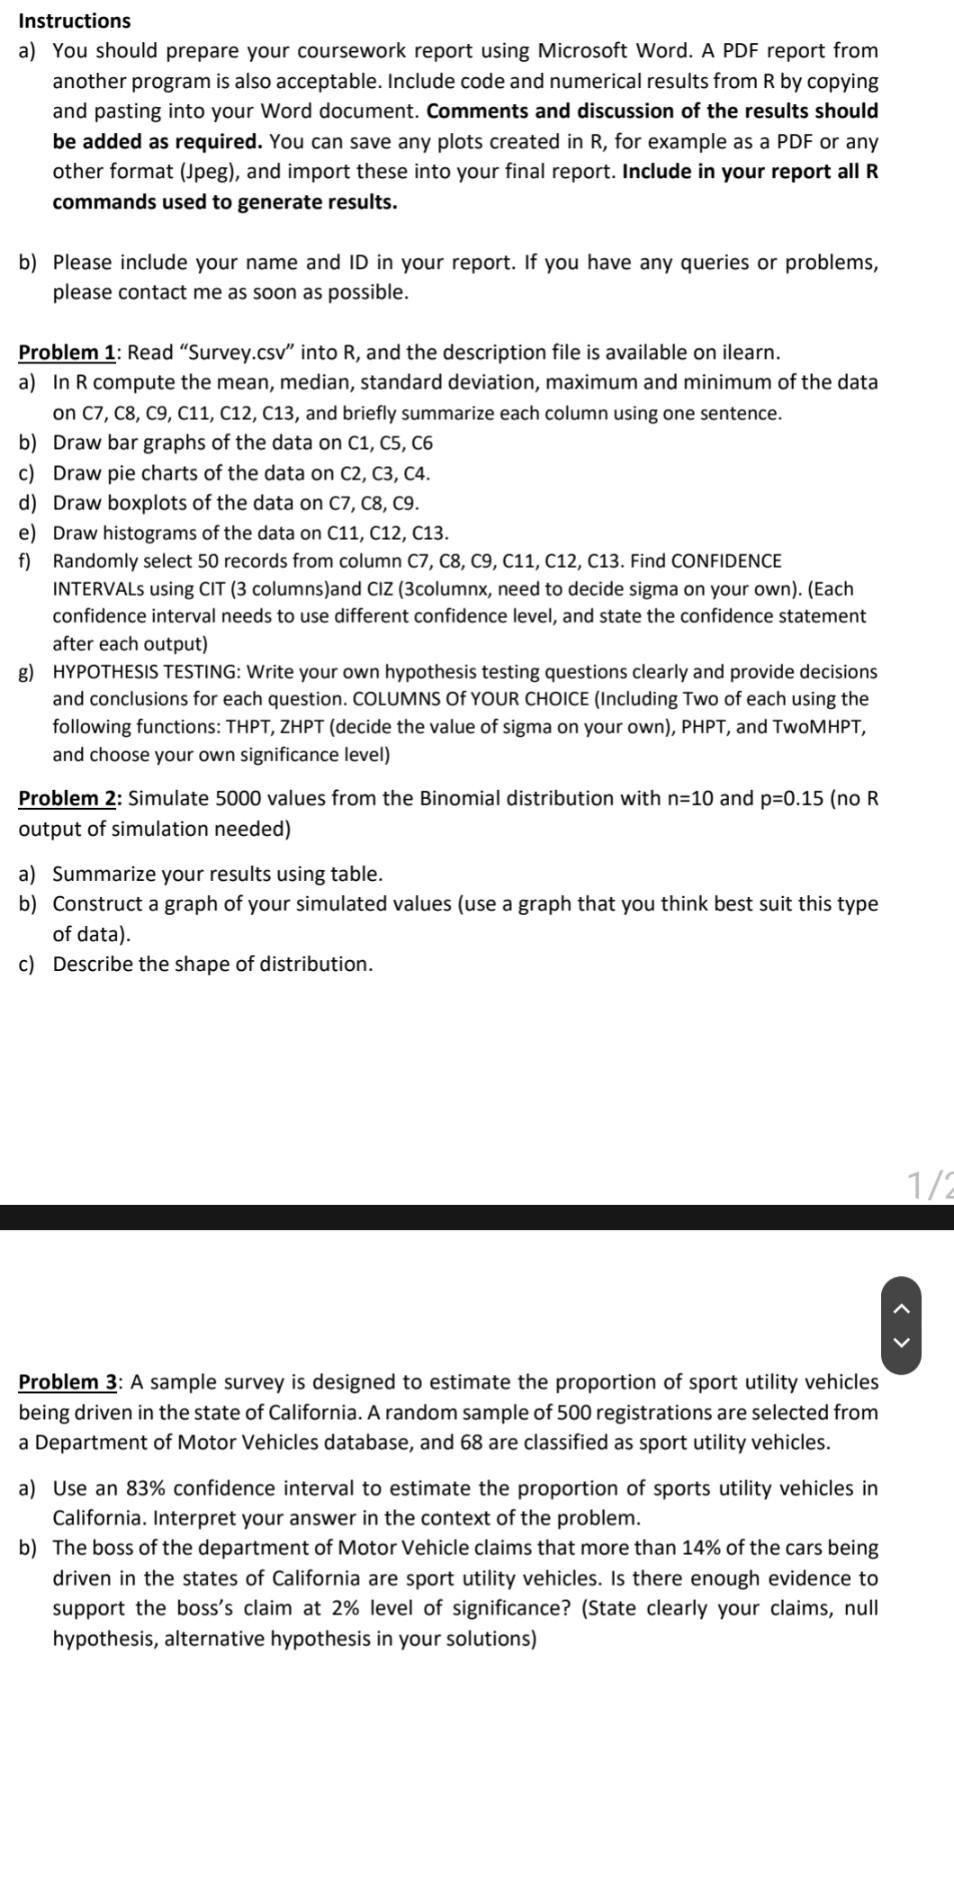
Instructions a) You should prepare your coursework report using Microsoft Word. A PDF report from another program is also acceptable. Include code and numerical results from R by copying and pasting into your Word document. Comments and discussion of the results should be added as required. You can save any plots created in R, for example as a PDF or any other format (Jpeg), and import these into your final report. Include in your report all R commands used to generate results. b) Please include your name and ID in your report. If you have any queries or problems, please contact me as soon as possible. Problem 1: Read “Survey.csv" into R, and the description file is available on ilearn. a) In R compute the mean, median, standard deviation, maximum and minimum of the data on C7, 08, 09, 211, 212, 213, and briefly summarize each column using one sentence. b) Draw bar graphs of the data on C1, C5, C6 c) Draw pie charts of the data on C2, C3, C4. d) Draw boxplots of the data on 07, 08, 09. e) Draw histograms of the data on C11, C12, C13. f) Randomly select 50 records from column C7, C8, C9, C11, C12, C13. Find CONFIDENCE INTERVALs using CIT (3 columns)and CIZ (3columnx, need to decide sigma on your own). (Each confidence interval needs to use different confidence level, and state the confidence statement after each output) g) HYPOTHESIS TESTING: Write your own hypothesis testing questions clearly and provide decisions and conclusions for each question. COLUMNS OF YOUR CHOICE (Including Two of each using the following functions: THPT, ZHPT (decide the value of sigma on your own), PHPT, and TWOMHPT, and choose your own significance level) Problem 2: Simulate 5000 values from the Binomial distribution with n=10 and p=0.15 (no R output of simulation needed) Summarize your results using table. b) Construct a graph of your simulated values (use a graph that you think best suit this type of data) c) Describe the shape of distribution. 1/2 Problem 3: A sample survey is designed to estimate the proportion of sport utility vehicles being driven in the state of California. A random sample of 500 registrations are selected from a Department of Motor Vehicles database, and 68 are classified as sport utility vehicles. a) Use an 83% confidence interval to estimate the proportion of sports utility vehicles in California. Interpret your answer in the context of the problem. b) The boss of the department of Motor Vehicle claims that more than 14% of the cars being driven in the states of California are sport utility vehicles. Is there enough evidence to support the boss's claim at 2% level of significance? (State clearly your claims, null hypothesis, alternative hypothesis in your solutions)