Page 1 of 1
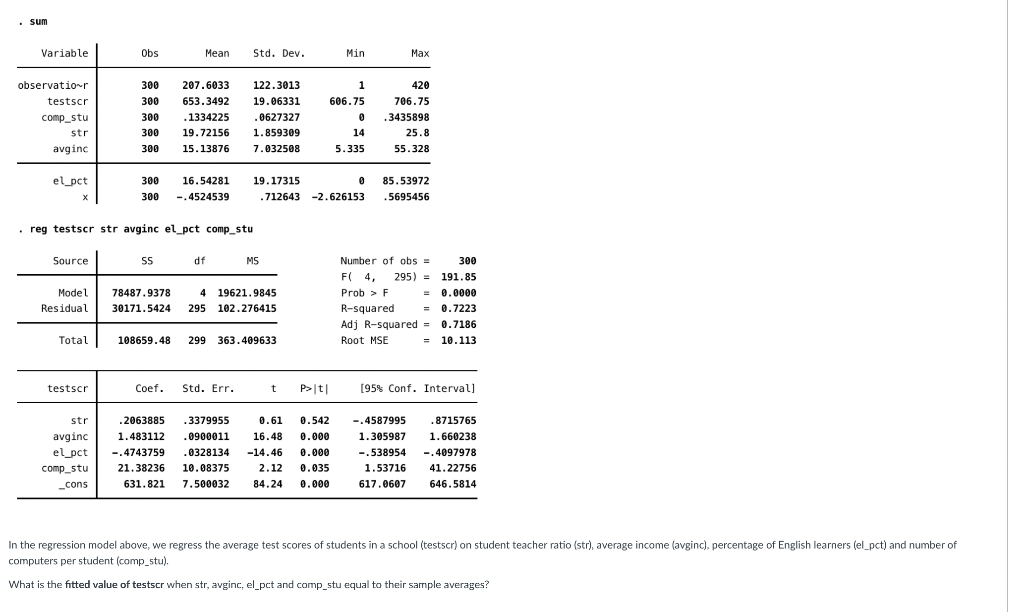
. sum Variable Obs Mean Std. Dev. Min Max 300 1 observatior testscr comp_stu str avginc 207.6033 653.3492 .1334225 19.72
Posted: Mon May 09, 2022 12:08 pm
by answerhappygod
- Sum Variable Obs Mean Std Dev Min Max 300 1 Observatior Testscr Comp Stu Str Avginc 207 6033 653 3492 1334225 19 72 1 (221.75 KiB) Viewed 35 times
. sum Variable Obs Mean Std. Dev. Min Max 300 1 observatior testscr comp_stu str avginc 207.6033 653.3492 .1334225 19.72156 15.13876 300 300 300 300 122.3013 19.06331 .0627327 1.859309 7.032508 606.75 © 420 706.75 .3435898 25.8 55.328 14 5.335 el_pct 300 16.54281 19.17315 .712643 85.53972 .5695456 300 -.4524539 -2.626153 • reg testscr str avginc el_pct comp_stu Source SS df MS Model Residual 78487.9378 30171.5424 4 19621.9845 295 102.276415 Number of obs = 300 Fl 4, 295) = 191.85 = Prob > F = 0.0000 R-squared = 0.7223 Adj R-squared = 0.7186 Root MSE = 10.113 = Total 108659.48 299 363.409633 testscr Coef. Std. Err. t P>It! [95% Conf. Intervall str avginc el_pct comp_stu _cons .2063885 1.483112 -.4743759 21.38236 631.821 .3379955 .0900011 .0328134 10.08375 7.500032 0.61 16.48 -14.46 2.12 84.24 0.542 0.000 0.000 0.035 0.000 -.4587995 1.305987 -.538954 1.53716 617.0607 .8715765 1.660238 -.4097978 41.22756 646.5814 In the regression model above, we regress the average test scores of students in a school (testscr) on student teacher ratio (str), average income (avginc), percentage of English learners (el_pct) and number of computers per student (comp_stu). ( What is the fitted value of testscr when str, avginc, el_pct and comp_stu equal to their sample averages?