Page 1 of 1
Q5: [15 pts] Graphical Models Show that the marginal distribution for the variables xs in a factor fs (xs) in a tree-str
Posted: Mon May 09, 2022 10:34 am
by answerhappygod
- Q5 15 Pts Graphical Models Show That The Marginal Distribution For The Variables Xs In A Factor Fs Xs In A Tree Str 1 (28.4 KiB) Viewed 28 times
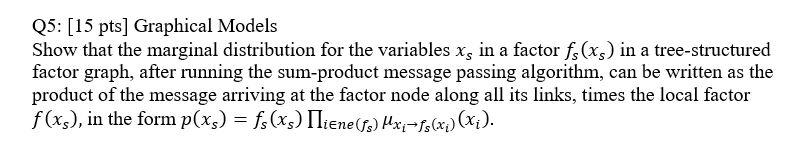
Q5: [15 pts] Graphical Models Show that the marginal distribution for the variables xs in a factor fs (xs) in a tree-structured factor graph, after running the sum-product message passing algorithm, can be written as the product of the message arriving at the factor node along all its links, times the local factor f(xs), in the form p(xs) = fs(xs) Niene (53) Mx4-f5(xp) (xi). =