Page 1 of 1
200 4. (12 pts) The figure below shows the Stress (logarithmic scale) versus steady-state creep rate (logarithmic scale)
Posted: Mon May 09, 2022 10:20 am
by answerhappygod
- 200 4 12 Pts The Figure Below Shows The Stress Logarithmic Scale Versus Steady State Creep Rate Logarithmic Scale 1 (40.08 KiB) Viewed 27 times
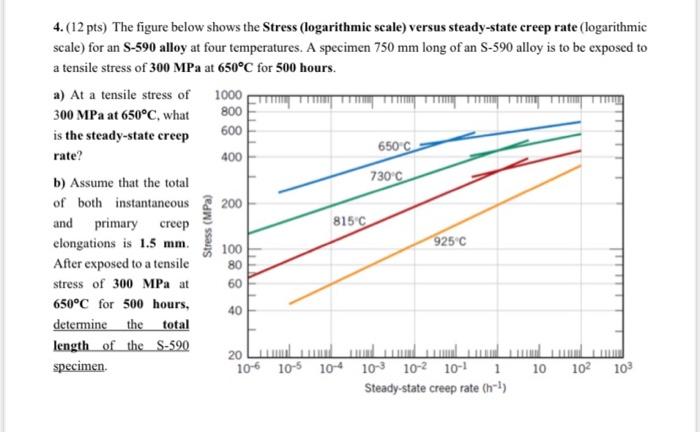
200 4. (12 pts) The figure below shows the Stress (logarithmic scale) versus steady-state creep rate (logarithmic scale) for an S-590 alloy at four temperatures. A specimen 750 mm long of an S-590 alloy is to be exposed to a tensile stress of 300 MPa at 650°C for 500 hours. a) At a tensile stress of 1000 300 MPa at 650°C, what 800 is the steady-state creep 600 650°C rate? 400 b) Assume that the total 730°C of both instantaneous and primary creep elongations is 1.5 mm 100 925°C After exposed to a tensile stress of 300 MPa at 650°C for 500 hours, 40 determine the total length of the S-590 specimen 10-6 105 104 103 102 10-1 1 10 102 103 Steady-state creep rate (nl) Stress (MPa) 8150 a 80 60 اس اس اس اس اس اس اس اسلام2