Page 1 of 1
Figure 1 shows the copper-silver phase diagram. Use this diagram to determiner the fraction of the total mass of the all
Posted: Mon May 09, 2022 9:13 am
by answerhappygod
- Figure 1 Shows The Copper Silver Phase Diagram Use This Diagram To Determiner The Fraction Of The Total Mass Of The All 1 (35.1 KiB) Viewed 24 times
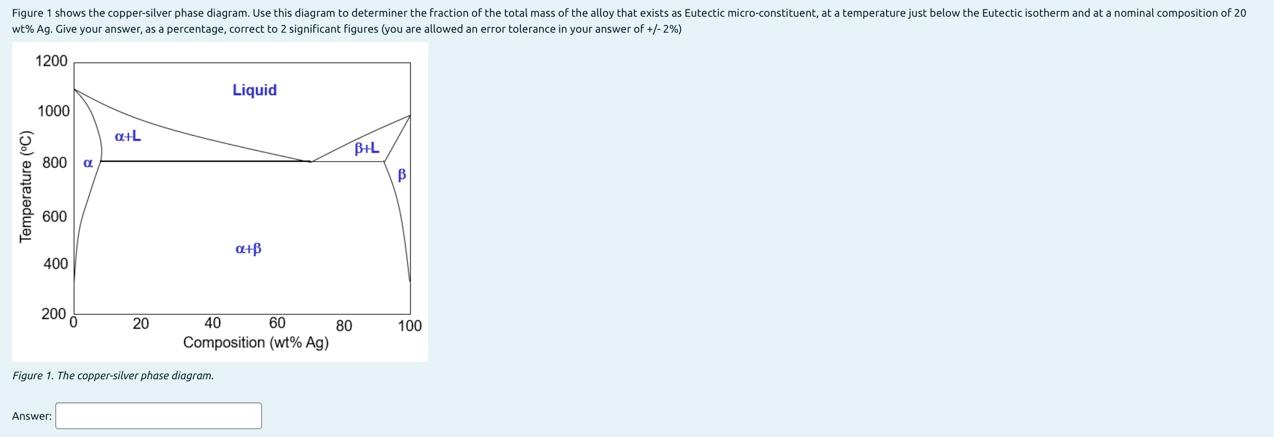
Figure 1 shows the copper-silver phase diagram. Use this diagram to determiner the fraction of the total mass of the alloy that exists as Eutectic micro-constituent, at a temperature just below the Eutectic isotherm and at a nominal composition of 20 wt% Ag. Give your answer, as a percentage, correct to 2 significant figures (you are allowed an error tolerance in your answer of +/-2%) 1200 Liquid 1000 a+L BIL 800 OL Temperature (°C) 600 auß 400 200 20 100 40 60 80 Composition (wt% Ag) Figure 1. The copper-silver phase diagram. Answer: