Page 1 of 1
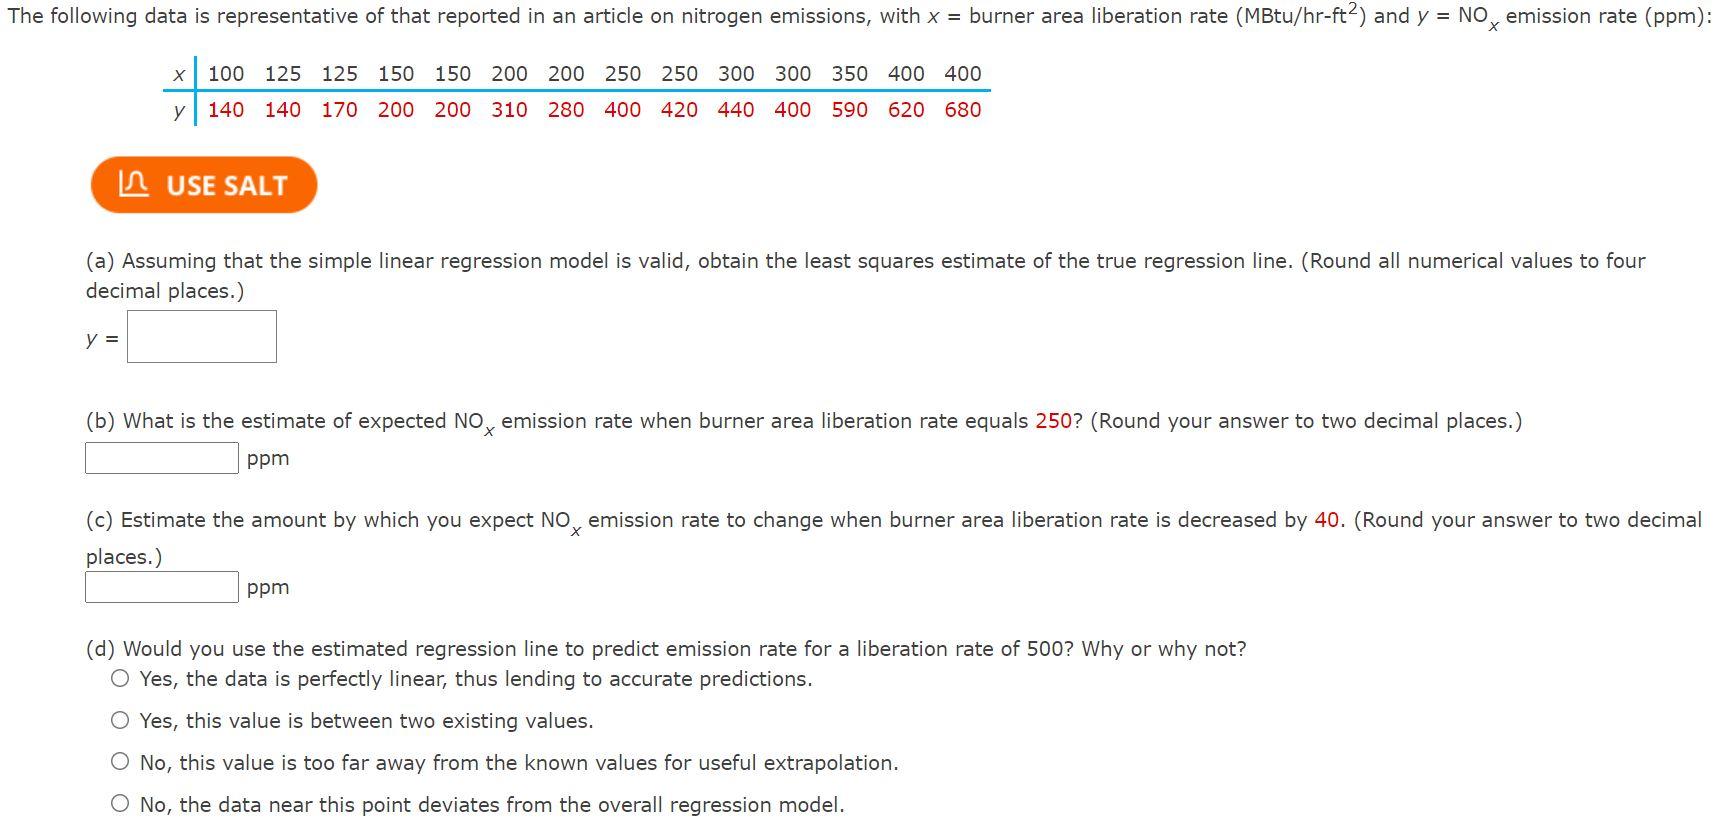
The following data is representative of that reported in an article on nitrogen emissions, with x = burner area liberati
Posted: Sun Oct 03, 2021 3:12 pm
by answerhappygod
- The Following Data Is Representative Of That Reported In An Article On Nitrogen Emissions With X Burner Area Liberati 1 (125.29 KiB) Viewed 151 times
The following data is representative of that reported in an article on nitrogen emissions, with x = burner area liberation rate (MBtu/hr-ft?) and y = NOx emission rate (ppm): X 100 125 125 150 150 200 200 250 250 300 300 350 400 400 y 140 140 170 200 200 310 280 400 420 440 400 590 620 680 I USE SALT (a) Assuming that the simple linear regression model is valid, obtain the least squares estimate of the true regression line. (Round all numerical values to four decimal places.) y = (b) What is the estimate of expected NOx emission rate when burner area liberation rate equals 250? (Round your answer to two decimal places.) ppm x (c) Estimate the amount by which you expect NO, emission rate to change when burner area liberation rate is decreased by 40. (Round your answer to two decimal places.) ppm (d) Would you use the estimated regression line to predict emission rate for a liberation rate of 500? Why or why not? O Yes, the data is perfectly linear, thus lending to accurate predictions. O Yes, this value is between two existing values. O No, this value is too far away from the known values for useful extrapolation. No, the data near this point deviates from the overall regression model.