Page 1 of 1
EXCEL DATA
Posted: Sun Oct 03, 2021 3:03 pm
by answerhappygod
- Excel Data 1 (220.55 KiB) Viewed 120 times
EXCEL DATA
- Excel Data 2 (45.47 KiB) Viewed 120 times
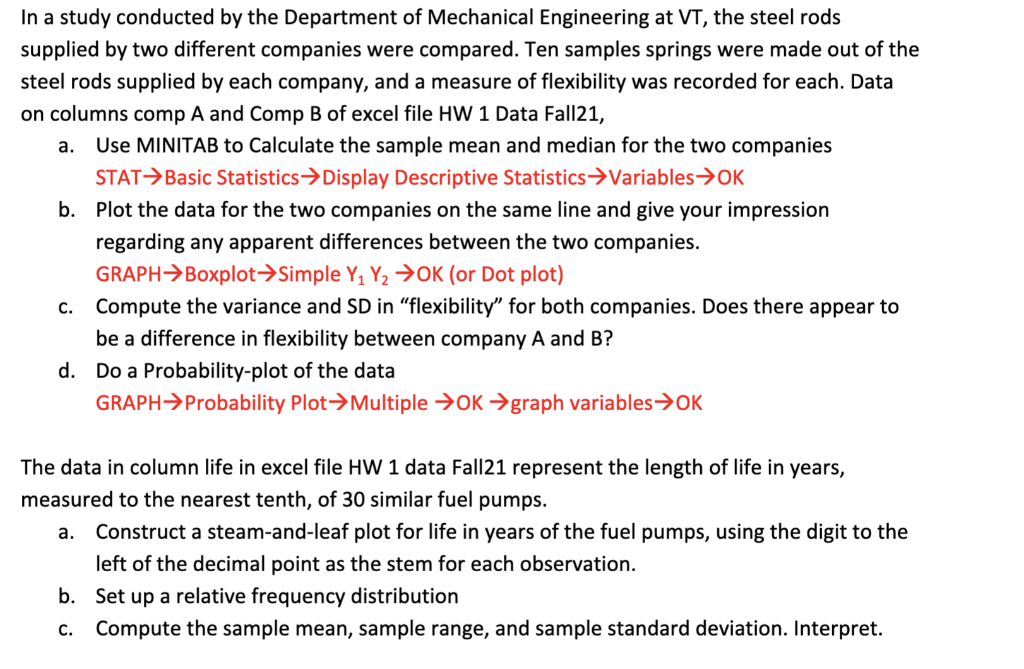
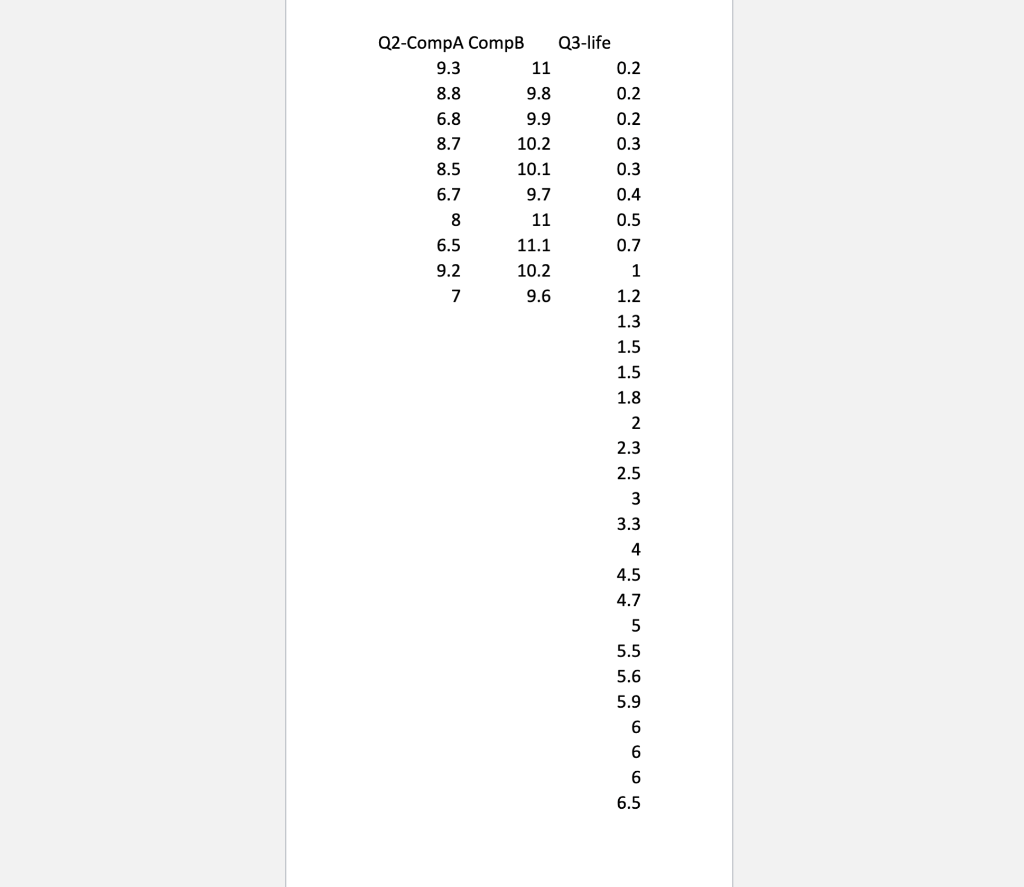
In a study conducted by the Department of Mechanical Engineering at VT, the steel rods supplied by two different companies were compared. Ten samples springs were made out of the steel rods supplied by each company, and a measure of flexibility was recorded for each. Data on columns comp A and Comp B of excel file HW 1 Data Fall21, a. Use MINITAB to Calculate the sample mean and median for the two companies STAT→Basic Statistics Display Descriptive Statistics →Variables →OK b. Plot the data for the two companies on the same line and give your impression regarding any apparent differences between the two companies. GRAPH>Boxplot Simple Y, Y2 →OK (or Dot plot) C. Compute the variance and SD in “flexibility” for both companies. Does there appear to be a difference in flexibility between company A and B? d. Do a Probability-plot of the data GRAPH+Probability Plot Multiple →OK →graph variables →OK a. The data in column life in excel file HW 1 data Fall21 represent the length of life in years, measured to the nearest tenth, of 30 similar fuel pumps. Construct a steam-and-leaf plot for life in years of the fuel pumps, using the digit to the left of the decimal point as the stem for each observation. b. Set up a relative frequency distribution Compute the sample mean, sample range, and sample standard deviation. Interpret. C.
Q2-CompA CompB Q3-life 9.3 11 0.2 8.8 9.8 0.2 6.8 9.9 0.2 8.7 10.2 0.3 8.5 10.1 0.3 6.7 9.7 0.4 8 11 0.5 6.5 11.1 0.7 9.2 10.2 1 7 9.6 1.2 1.3 1.5 1.5 1.8 2 2.3 2.5 3 3.3 4 4.5 4.7 5 5.5 5.6 5.9 6 6 6 6.5