Page 1 of 1
QUESTION 2 (50) 2.1. You have been appointed by DWS, in the Directorate of Water Resources Systems Planning, to carry ou
Posted: Sun May 08, 2022 9:07 pm
by answerhappygod
- Question 2 50 2 1 You Have Been Appointed By Dws In The Directorate Of Water Resources Systems Planning To Carry Ou 1 (192.38 KiB) Viewed 33 times
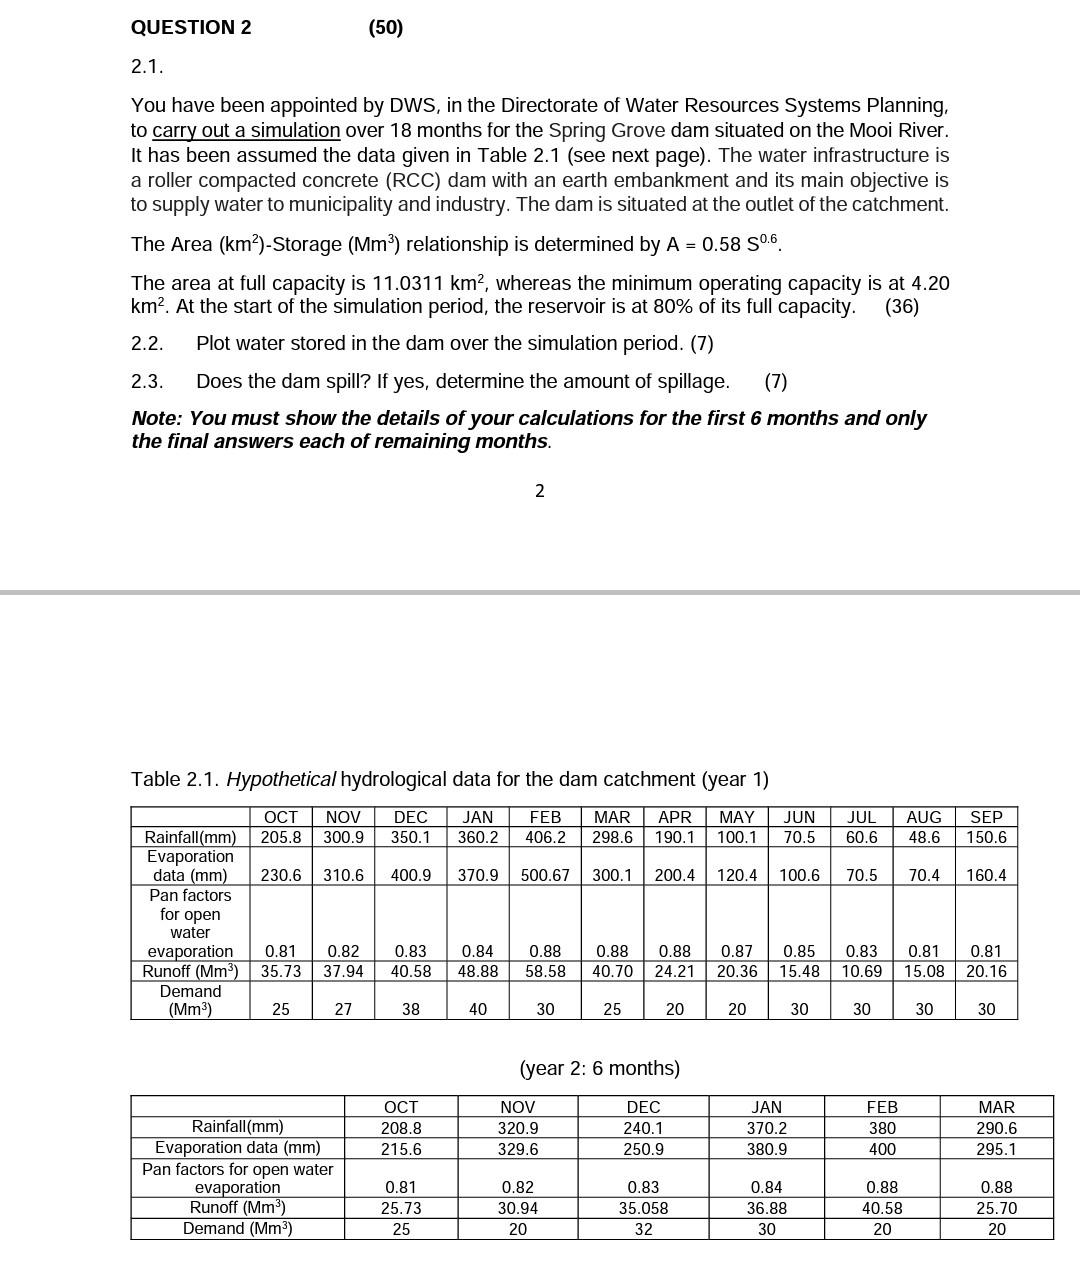
QUESTION 2 (50) 2.1. You have been appointed by DWS, in the Directorate of Water Resources Systems Planning, to carry out a simulation over 18 months for the Spring Grove dam situated on the Mooi River. It has been assumed the data given in Table 2.1 (see next page). The water infrastructure is a roller compacted concrete (RCC) dam with an earth embankment and its main objective is to supply water to municipality and industry. The dam is situated at the outlet of the catchment. The Area (km2)-Storage (Mm) relationship is determined by A = 0.58 50.6. The area at full capacity is 11.0311 km2, whereas the minimum operating capacity is at 4.20 km2. At the start of the simulation period, the reservoir is at 80% of its full capacity. (36) 2.2. Plot water stored in the dam over the simulation period. (7) 2.3. Does the dam spill? If yes, determine the amount of spillage. (7) Note: You must show the details of your calculations for the first 6 months and only the final answers each of remaining months. 2 Table 2.1. Hypothetical hydrological data for the dam catchment (year 1) DEC 350.1 JAN 360.2 FEB 406.2 MAR APR 298.6190.1 MAY 100.1 JUN 70.5 JUL 60.6 AUG 48.6 SEP 150.6 400.9 370.9 500.67 300.1 200.4 120.4 100.6 70.5 70.4 160.4 OCT NOV Rainfall(mm) 205.8 300.9 Evaporation data (mm) 230.6 310.6 Pan factors for open water evaporation 0.81 0.82 Runoff (Mm) 35.73 37.94 Demand (Mm) 25 27 0.83 40.58 0.84 48.88 0.88 58.58 0.88 40.70 0.88 24.21 0.87 20.36 0.85 15.48 0.83 10.69 0.81 0.81 15.08 20.16 38 40 30 25 20 20 30 30 30 30 (year 2: 6 months) OCT 208.8 215.6 NOV 320.9 329.6 DEC 240.1 250.9 JAN 370.2 380.9 FEB 380 400 MAR 290.6 295.1 Rainfall(mm) Evaporation data (mm) Pan factors for open water evaporation Runoff (Mm) Demand (Mm) 0.81 25.73 25 0.82 30.94 20 0.83 35.058 32 0.84 36.88 30 0.88 40.58 20 0.88 25.70 20