Page 1 of 1
Figure B3 shows the contour map of the area of a planned dam reservoir. The contour interval is 50 m and the contours of
Posted: Sun May 08, 2022 8:35 pm
by answerhappygod
- Figure B3 Shows The Contour Map Of The Area Of A Planned Dam Reservoir The Contour Interval Is 50 M And The Contours Of 1 (120.34 KiB) Viewed 29 times
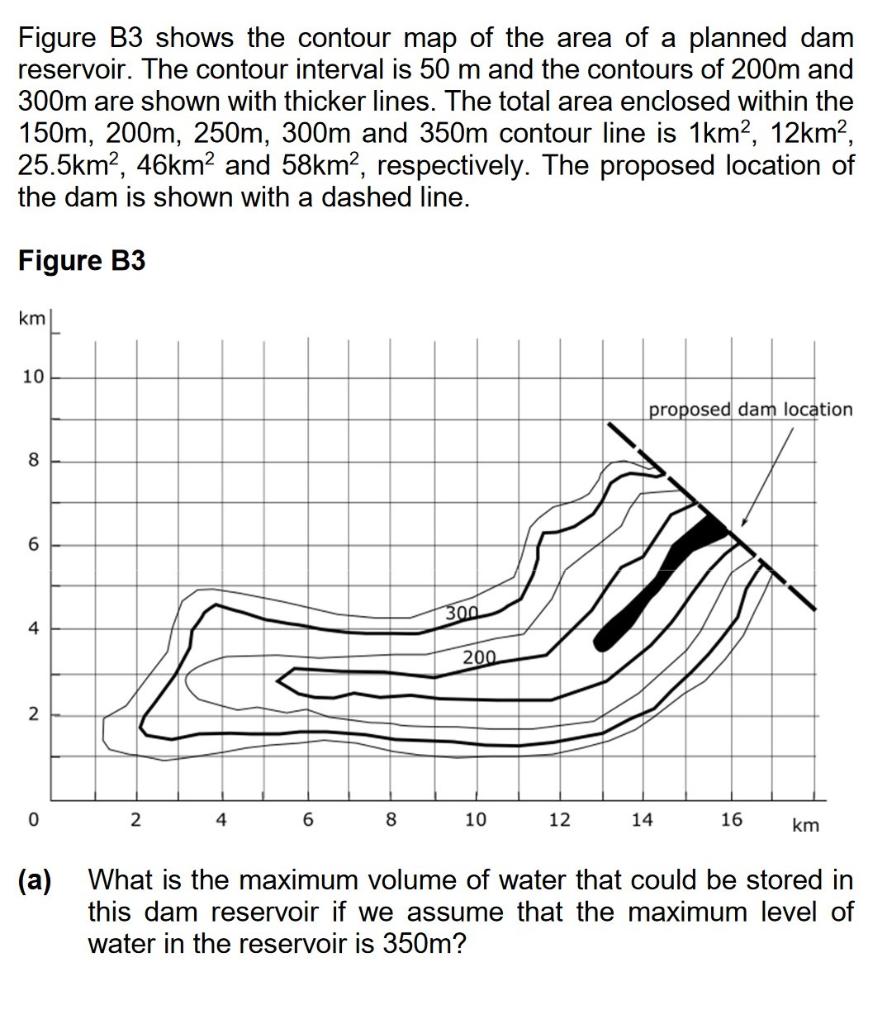
Figure B3 shows the contour map of the area of a planned dam reservoir. The contour interval is 50 m and the contours of 200m and 300m are shown with thicker lines. The total area enclosed within the 150m, 200m, 250m, 300m and 350m contour line is 1km2, 12km2, 25.5km2, 46km2 and 58km², respectively. The proposed location of the dam is shown with a dashed line. Figure B3 km 10 proposed dam location 8 6 300 4 C 200 2 0 2 4 6 8 10 12 14 16 km (a) What is the maximum volume of water that could be stored in this dam reservoir if we assume that the maximum level of water in the reservoir is 350m?