Page 1 of 1
An advertising firm wishes to demonstrate to its clients the effectiveness of the advertising campaigns it has conducted
Posted: Sun Oct 03, 2021 12:51 pm
by answerhappygod
- An Advertising Firm Wishes To Demonstrate To Its Clients The Effectiveness Of The Advertising Campaigns It Has Conducted 1 (53.01 KiB) Viewed 131 times

- An Advertising Firm Wishes To Demonstrate To Its Clients The Effectiveness Of The Advertising Campaigns It Has Conducted 2 (53.01 KiB) Viewed 131 times
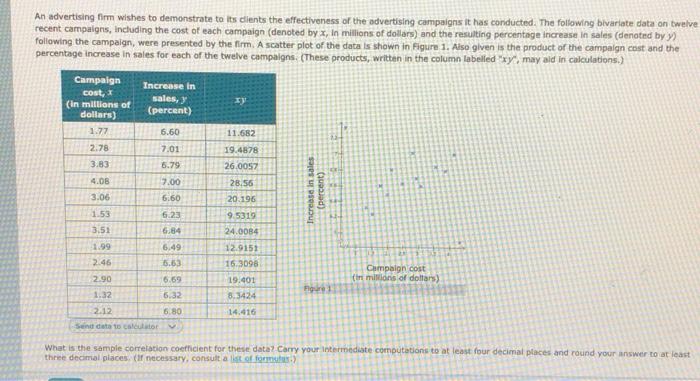
An advertising firm wishes to demonstrate to its clients the effectiveness of the advertising campaigns it has conducted. The following bivariate data on twelve recent campaigns, including the cost of each campaign (denoted by x, in millions of dollars) and the resulting percentage increase in sales (denoted by ) following the campaign, were presented by the firm. A scatter plot of the data is shown in Figure 1. Also given is the product of the campaign cost and the percentage increase in sales for each of the twelve campaigns. (These products, written in the column labelled "xy, may ald in calculations.) Campaign Increase in cost, (in millions of sales, y dollars) (percent) 1.77 6.60 11.682 2.78 7.01 19.4878 3.83 6.79 26.0057 4.06 7.00 28.56 3.06 6:60 20.196 1.53 6:23 9.5319 3.51 6.84 24.0084 1.99 6.49 12.9151 2.46 5.63 16.3098 Campaign cost 2.90 6.69 19.401 (in milions of dollars) Figure 1 1.32 6.32 8.3424 2.12 6.80 14.416 Sen data to calculator Increase in sales (percent) What is the sample correlation coefficient for these data? Carry your intermediate computations to at least four decimal places and round your answer to at least three decimal places (if necessary, consult a list of formu