Page 1 of 1
2. You are given the following sample containing households' income and spending data. Assume the distributions are bell
Posted: Sun Oct 03, 2021 12:39 pm
by answerhappygod
- 2 You Are Given The Following Sample Containing Households Income And Spending Data Assume The Distributions Are Bell 1 (55.6 KiB) Viewed 264 times
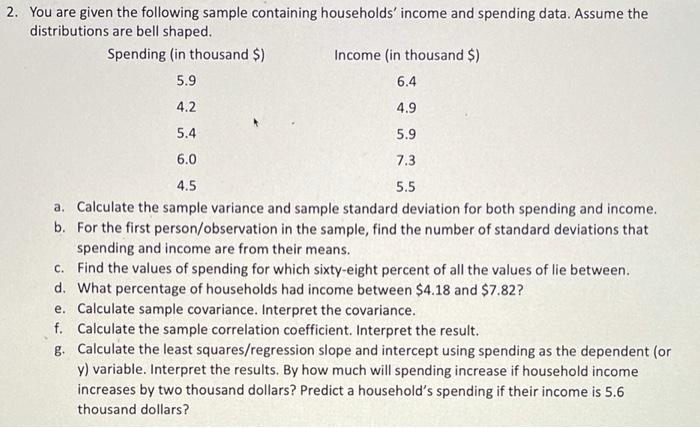
2. You are given the following sample containing households' income and spending data. Assume the distributions are bell shaped. Spending (in thousand $) Income (in thousand $) 5.9 6.4 4.2 4.9 5.4 5.9 6.0 7.3 4.5 5.5 a. Calculate the sample variance and sample standard deviation for both spending and income. b. For the first person/observation in the sample, find the number of standard deviations that spending and income are from their means. c. Find the values of spending for which sixty-eight percent of all the values of lie between. d. What percentage of households had income between $4.18 and $7.82? e. Calculate sample covariance. Interpret the covariance. f. Calculate the sample correlation coefficient. Interpret the result. 8. Calculate the least squares/regression slope and intercept using spending as the dependent (or y) variable. Interpret the results. By how much will spending increase if household income increases by two thousand dollars? Predict a household's spending if their income is 5.6 thousand dollars?