Page 1 of 1
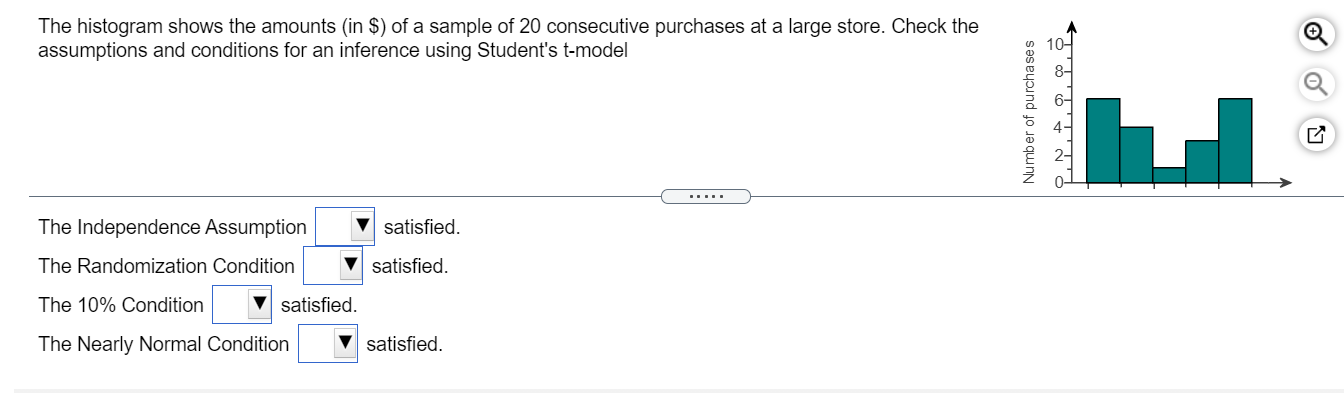
The histogram shows the amounts (in $) of a sample of 20 consecutive purchases at a large store. Check the assumptions a
Posted: Sun Oct 03, 2021 12:36 pm
by answerhappygod
- The Histogram Shows The Amounts In Of A Sample Of 20 Consecutive Purchases At A Large Store Check The Assumptions A 1 (44.65 KiB) Viewed 126 times
The histogram shows the amounts (in $) of a sample of 20 consecutive purchases at a large store. Check the assumptions and conditions for an inference using Student's t-model Number of purchases ܝܫܺܝܤܝܝܐܝܐ The Independence Assumption satisfied. The Randomization Condition satisfied. The 10% Condition V satisfied. The Nearly Normal Condition satisfied.