Page 1 of 1
A sample of 50 TV viewers were asked, "Should TV sponsors pull their sponsorship from the programs that draw numerous vi
Posted: Sun Oct 03, 2021 12:30 pm
by answerhappygod
- A Sample Of 50 Tv Viewers Were Asked Should Tv Sponsors Pull Their Sponsorship From The Programs That Draw Numerous Vi 1 (30.23 KiB) Viewed 146 times
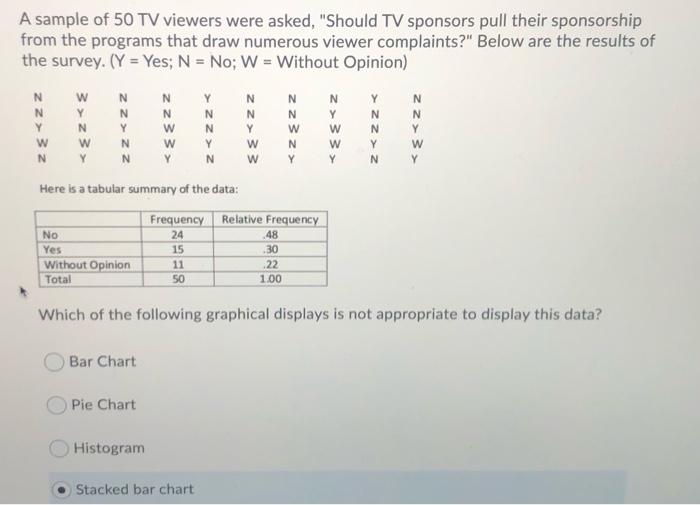
A sample of 50 TV viewers were asked, "Should TV sponsors pull their sponsorship from the programs that draw numerous viewer complaints?" Below are the results of the survey. (Y = Yes; N = No; W = Without Opinion) N N Y w N w Y N w Y N N Y N N N w w Y N N Y N NN N Y w zzz <६६<z Y N N Y N N N Y w Y Here is a tabular summary of the data: Frequency Relative Frequency No 24 Yes 15 .30 Without Opinion 11 22 Total 1.00 48 50 Which of the following graphical displays is not appropriate to display this data? Bar Chart Pie Chart Histogram Stacked bar chart