Page 1 of 1
10. Show all your work and circle your answers. The data set below gives the weights of n=30 cans of Regular Coke, in po
Posted: Sun Oct 03, 2021 11:38 am
by answerhappygod
- 10 Show All Your Work And Circle Your Answers The Data Set Below Gives The Weights Of N 30 Cans Of Regular Coke In Po 1 (128.07 KiB) Viewed 141 times
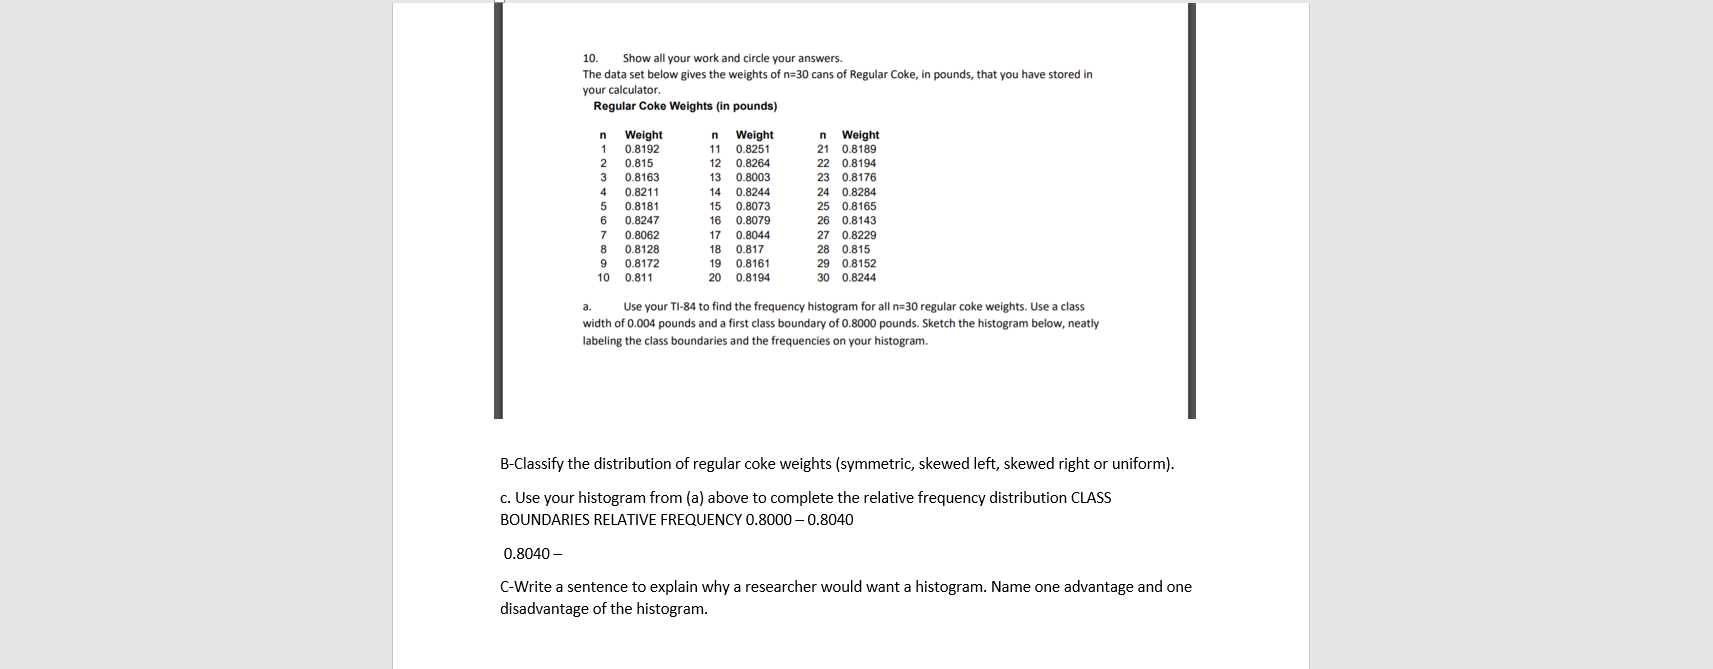
10. Show all your work and circle your answers. The data set below gives the weights of n=30 cans of Regular Coke, in pounds, that you have stored in your calculator Regular Coke Weights (in pounds) 0.8211 n Weight 1 0.8192 20.815 3 0.8163 4 5 0.8181 6 0.8247 7 0.8062 8 0.8128 9 0.8172 10 0.811 n Weight 11 0.8251 12 0.8264 13 0.8003 14 0.8244 15 0.8073 16 0.8079 17 0.8044 18 0.817 19 0.8161 20 0.8194 n Weight 21 0.8189 22 0.8194 23 0.8176 24 0.8284 25 0.8165 26 0.8143 27 0.8229 28 0.815 29 0.8152 30 0.8244 a. Use your TI-84 to find the frequency histogram for all n=30 regular coke weights. Use a class width of 0.004 pounds and a first class boundary of 0.8000 pounds. Sketch the histogram below, neatly labeling the class boundaries and the frequencies on your histogram. B-Classify the distribution of regular coke weights (symmetric, skewed left, skewed right or uniform). c. Use your histogram from (a) above to complete the relative frequency distribution CLASS BOUNDARIES RELATIVE FREQUENCY 0.8000-0.8040 0.8040 - C-Write a sentence to explain why a researcher would want a histogram. Name one advantage and one disadvantage of the histogram.