Page 1 of 1
1. Consider the function f(x, y) described by the contour diagram, where level curves f(x, y) = k are plotted for differ
Posted: Fri May 06, 2022 6:30 am
by answerhappygod
- 1 Consider The Function F X Y Described By The Contour Diagram Where Level Curves F X Y K Are Plotted For Differ 1 (32.96 KiB) Viewed 48 times
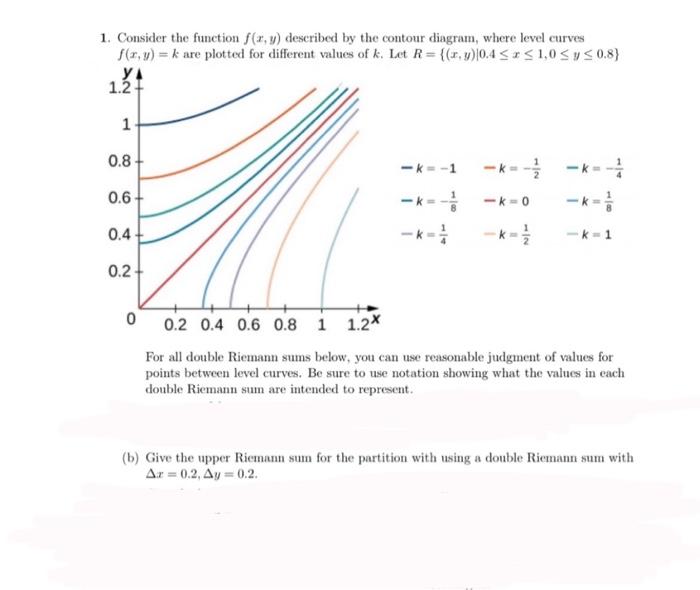
1. Consider the function f(x, y) described by the contour diagram, where level curves f(x, y) = k are plotted for different values of k. Let R={(x,y) 0.4 ≤x≤ 1,0 ≤ y ≤0.8} YA 1.2 1 0.8+ -k=-1 -K-- -k=-=-=- 0.6- -K---- -k=0 0.4+ -k-²/ -k=1 0.2+ 0 0.2 0.4 0.6 0.8 1 1.2* For all double Riemann sums below, you can use reasonable judgment of values for points between level curves. Be sure to use notation showing what the values in each double Riemann sum are intended to represent. (b) Give the upper Riemann sum for the partition with using a double Riemann sum with Ar=0.2, Ay=0.2.