Page 1 of 1
The following problem pertains to matching a given dipole pattern to the corresponding dipole length. Figure 5 shows thr
Posted: Fri May 06, 2022 6:26 am
by answerhappygod
- The Following Problem Pertains To Matching A Given Dipole Pattern To The Corresponding Dipole Length Figure 5 Shows Thr 1 (88.04 KiB) Viewed 45 times
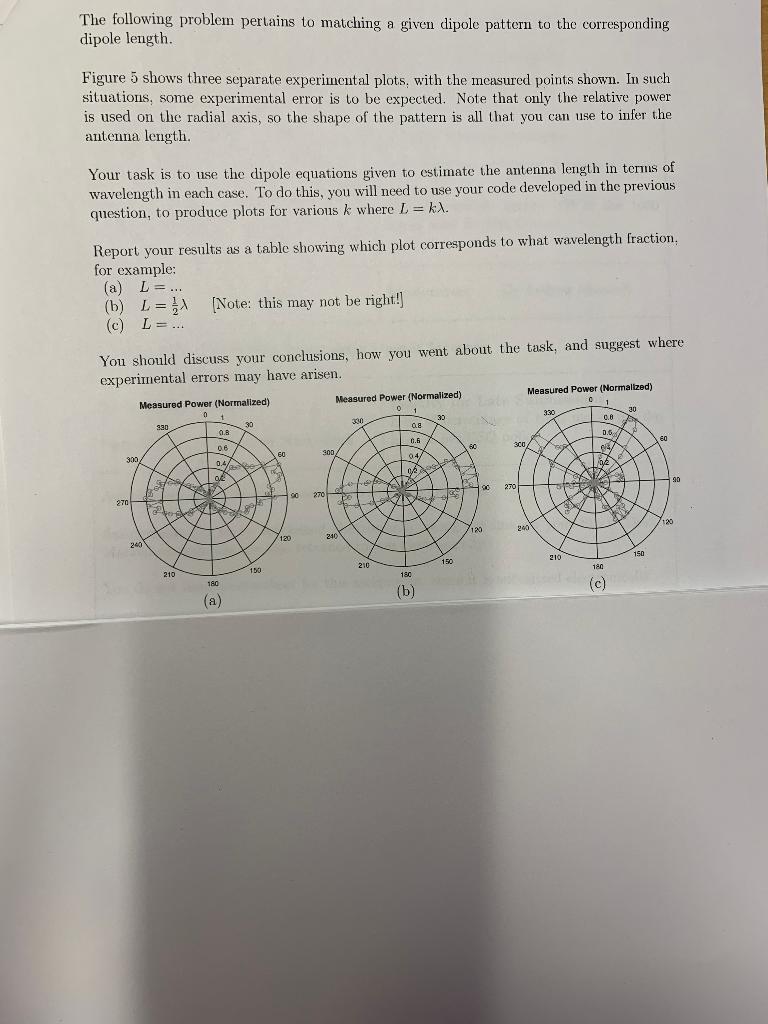
The following problem pertains to matching a given dipole pattern to the corresponding dipole length. Figure 5 shows three separate experimental plots, with the measured points shown. In such situations, some experimental error is to be expected. Note that only the relative power is used on the radial axis, so the shape of the pattern is all that you can use to infer the antenna length. Your task is to use the dipole equations given to estimate the antenna length in terms of wavelength in each case. To do this, you will need to use your code developed in the previous question, to produce plots for various k where L = kx. Report your results as a table showing which plot corresponds to what wavelength fraction. for example: (a) L=... (b) L= [Note: this may not be right!] (c) L L = ... You should discuss your conclusions, how you went about the task, and suggest where experimental errors may have arisen. Measured Power (Normalized) Measured Power (Normalized) 01 Measured Power (Normalized) 3:30 0 1 0 1 330 30 30 30 300 0.8 0.8 A 0.6 0.6 0.4 04/ hele A12 Tes 873 K 711 180 (b) 300/ 270 240 e 2 feer 210 Tac X XBX 180 (a) 150 60 120 300 90 270 240 po 210 Zgoed gos 9 150 60 300 190 270 120 240 210 0.8 0.0 0²/ 19/2 AY 180 (c) 3821 150 60 120 90