Page 1 of 1
1. Two pulleys are tested to determine the maximum weight they can support. The data, measured in pounds, of the test re
Posted: Fri May 06, 2022 6:03 am
by answerhappygod
- 1 Two Pulleys Are Tested To Determine The Maximum Weight They Can Support The Data Measured In Pounds Of The Test Re 1 (46.72 KiB) Viewed 31 times
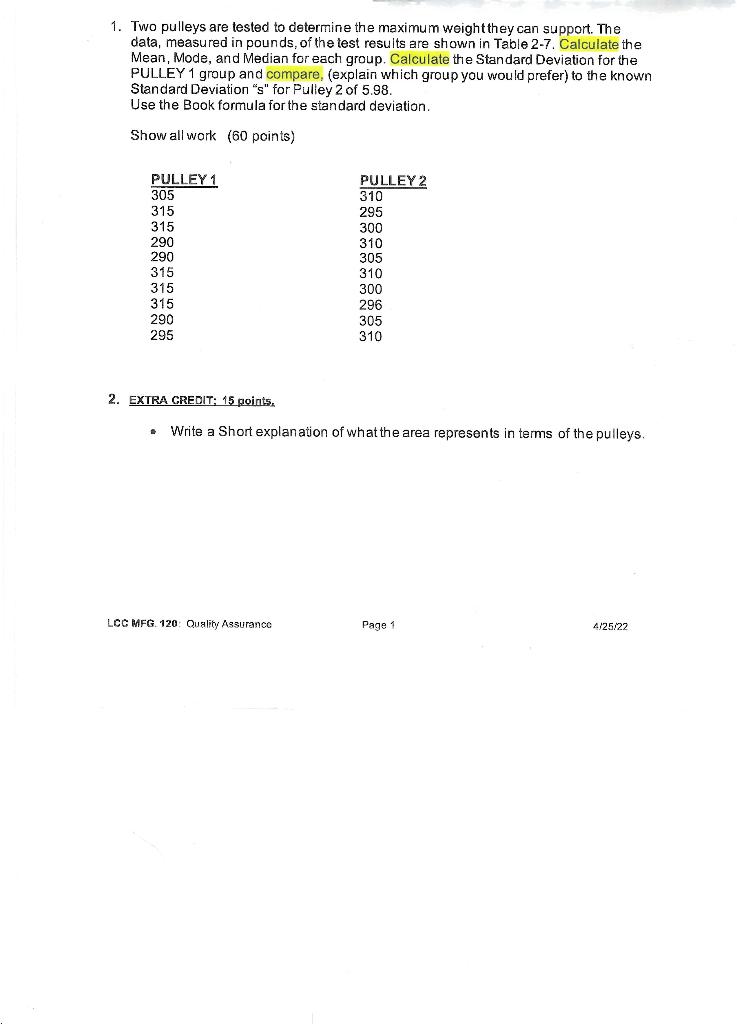
1. Two pulleys are tested to determine the maximum weight they can support. The data, measured in pounds, of the test results are shown in Table 2-7. Calculate the Mean, Mode, and Median for each group. Calculate the Standard Deviation for the PULLEY 1 group and compare, (explain which group you would prefer) to the known Standard Deviation "s" for Pulley 2 of 5.98. Use the Book formula for the standard deviation. Show all work (60 points) PULLEY 1 PULLEY 2 305 310 315 295 315 300 290 310 290 305 315 310 315 300 315 296 290 305 295 310 2. EXTRA CREDIT; 15 points, Write a Short explanation of what the area represents in terms of the pulleys. Page 1 4/25/22 LCC MFG. 120: Quality Assurance