- Question 1 In A Study To Analyse Performance In A 2020 Examination Series The Following Scores In A Percentage Were Comp 1 (50.26 KiB) Viewed 25 times
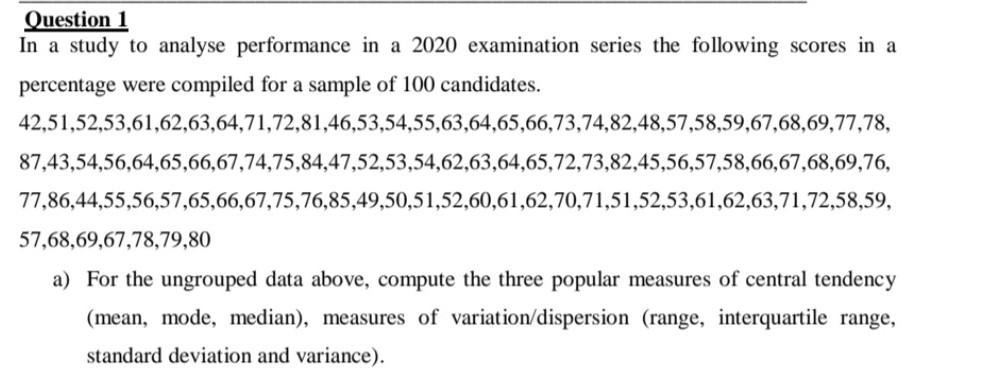
Question 1 In a study to analyse performance in a 2020 examination series the following scores in a percentage were compiled for a sample of 100 candidates. 42,51,52,53,61,62,63,64,71,72,81,46,53,54,55,63,64,65,66,73,74,82,48,57,58,59,67,68,69,77,78, 87,43,54,56,64,65,66,67,74,75,84,47,52,53,54,62,63,64,65,72,73,82,45,56,57,58,66,67,68,69,76, 77,86,44,55,56,57,65,66,67,75,76,85,49,50,51,52,60,61,62,70,71,51,52,53,61,62,63,71,72,58,59, 57,68,69,67,78,79,80 a) For the ungrouped data above, compute the three popular measures of central tendency (mean, mode, median), measures of variation/dispersion (range, interquartile range, standard deviation and variance).