Page 1 of 1
3. A comparison of the undergraduate grade point averages (GPA) of 12 corporate em- ployees with their scores on a manag
Posted: Thu May 05, 2022 9:12 pm
by answerhappygod
- 3 A Comparison Of The Undergraduate Grade Point Averages Gpa Of 12 Corporate Em Ployees With Their Scores On A Manag 1 (33.74 KiB) Viewed 23 times
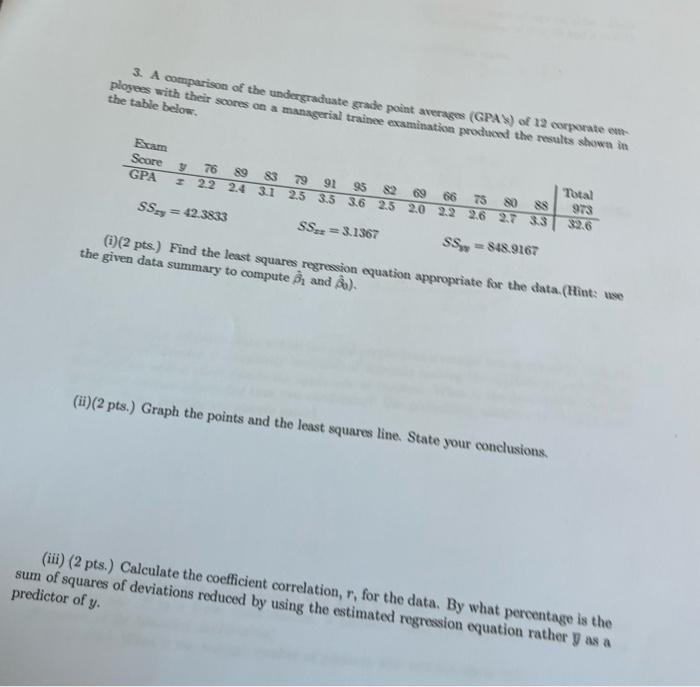
3. A comparison of the undergraduate grade point averages (GPA) of 12 corporate em- ployees with their scores on a managerial trainee examination produced the results shown in the table below. Exam Total 83 79 91 95 82 66 75 80 88 973 Score 376 89 H 2.2 2.4 3.1 2.5 3.5 3.6 2.5 2.0 2.2 2.6 2.7 3.3 GPA $2.6 SS=42.3833 SS₂2=3.1367 SS=848.9167 (i)(2 pts.) Find the least squares regression equation appropriate for the data. (Hint: use the given data summary to compute ₁ and 2). (ii) (2 pts.) Graph the points and the least squares line. State your conclusions. (iii) (2 pts.) Calculate the coefficient correlation, r, for the data. By what percentage is the sum of squares of deviations reduced by using the estimated regression equation rather as a predictor of y.