Page 1 of 1
Representative data read from a plot on runoff sediment concentration for plots with varying amounts of grazing damage,
Posted: Thu May 05, 2022 7:37 pm
by answerhappygod
- Representative Data Read From A Plot On Runoff Sediment Concentration For Plots With Varying Amounts Of Grazing Damage 1 (17.31 KiB) Viewed 34 times
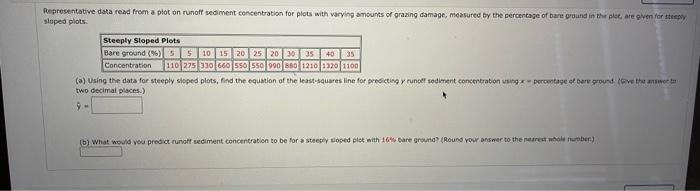
Representative data read from a plot on runoff sediment concentration for plots with varying amounts of grazing damage, measured by the percentage of bare ground in the plot, are given for steeply sloped plots. Steeply Sloped Plots Bare ground (%) 5 5 10 15 20 25 20 30 35 40 35 Concentration 110 275 330 660 550 550 990 880 1210 1320 1100 (a) Using the data for steeply sloped plots, find the equation of the least-squares line for predicting y runoff sediment concentration using percentage of bare ground (Give the answer to two decimal places.) 9- (b) What would you predict runoff sediment concentration to be for a steeply sloped plot with 16% bare ground? (Round your answer to the nearest whole number)