Page 1 of 1
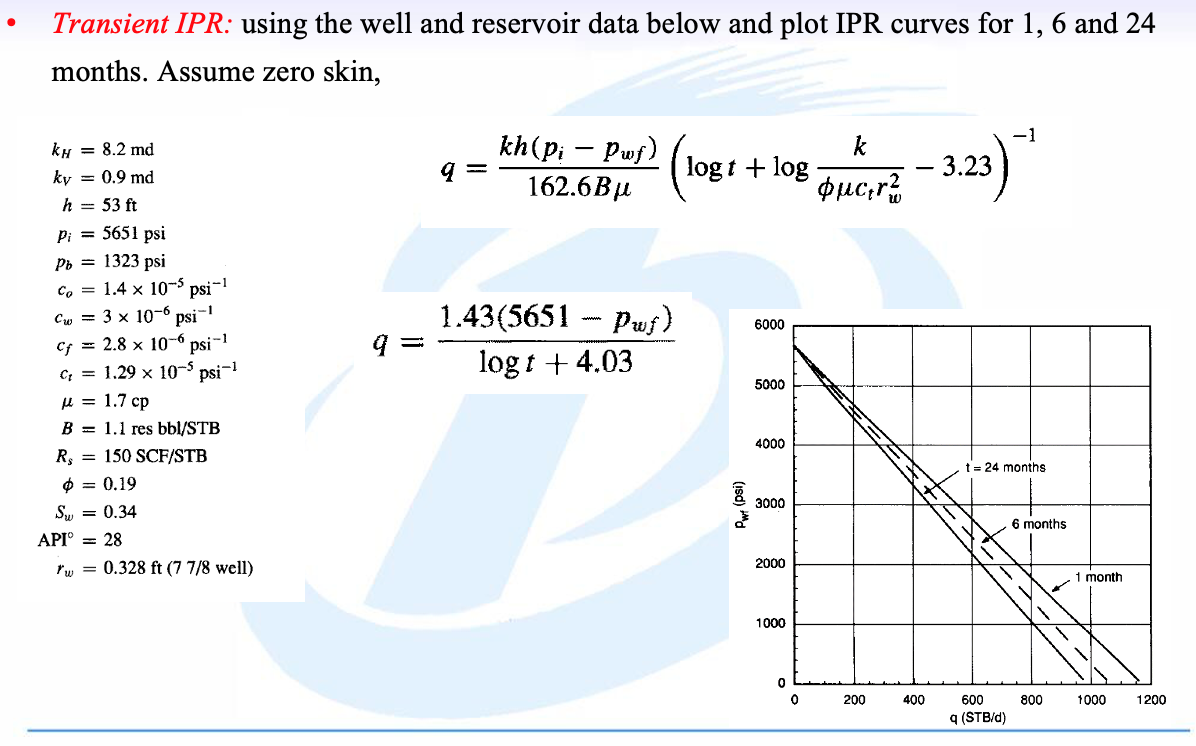
● Transient IPR: using the well and reservoir data below and plot IPR curves for 1, 6 and 24 months. Assume zero skin, k
Posted: Thu May 05, 2022 5:51 pm
by answerhappygod
- Transient Ipr Using The Well And Reservoir Data Below And Plot Ipr Curves For 1 6 And 24 Months Assume Zero Skin K 1 (239.6 KiB) Viewed 25 times
● Transient IPR: using the well and reservoir data below and plot IPR curves for 1, 6 and 24 months. Assume zero skin, kH = 8.2 md k -1 ky = 0.9 md q kh(pi - Pwf) 162.63μ logt + log h = 53 ft puer² -3.23) ¹ pμc,r² Pi = 5651 psi Pb = 1323 psi Co=1.4 x 10⁻⁵ psi-1 Cw = 3 x 10⁻⁶ psi-¹ 6000 Cf 2.8 x 10⁻⁶ psi-1 1.43(5651 – Pwƒ) logt +4.03 Ct = 1.29 x 10⁻⁵ 5000 μ = 1.7 cp B = 1.1 res bbl/STB R, 150 SCF/STB 4000 = 0.19 t = 24 months Sw = 0.34 3000 APIⓇ = 28 rw = 0.328 ft (7 7/8 well) 2000 1000 psi-¹ 9 Pwf (psi) 0 0 200 400 600 q (STB/d) 6 months 800 1 month 1000 1200