Page 1 of 1
A graph of v(t) is shown for a world-class track sprinter in a 100-m race. (See Figure 48.1. (a) What is his average vel
Posted: Thu May 05, 2022 5:37 pm
by answerhappygod
- A Graph Of V T Is Shown For A World Class Track Sprinter In A 100 M Race See Figure 48 1 A What Is His Average Vel 1 (55.73 KiB) Viewed 52 times
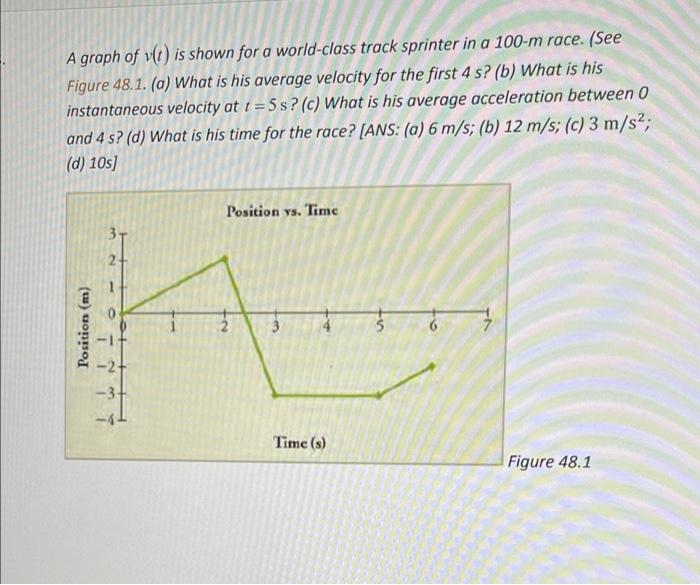
A graph of v(t) is shown for a world-class track sprinter in a 100-m race. (See Figure 48.1. (a) What is his average velocity for the first 4 s? (b) What is his instantaneous velocity at t=5s? (c) What is his average acceleration between 0 and 4 s? (d) What is his time for the race? [ANS: (a) 6 m/s; (b) 12 m/s; (c) 3 m/s²; (d) 10s] Position vs. Time Time (s) Figure 48.1 Position (m) 32 2