Page 1 of 1
P5.3 The following description represents a temperature monitoring system. A thermocouple with a gain of 40 μV/°C is con
Posted: Thu May 05, 2022 2:51 pm
by answerhappygod
- 1 (47.19 KiB) Viewed 55 times
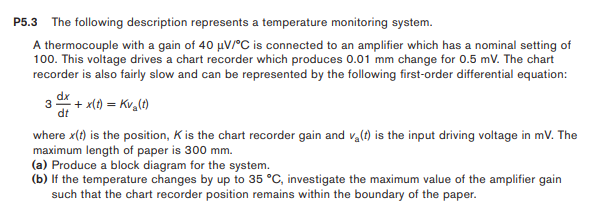
P5.3 The following description represents a temperature monitoring system. A thermocouple with a gain of 40 μV/°C is connected to an amplifier which has a nominal setting of 100. This voltage drives a chart recorder which produces 0.01 mm change for 0.5 mV. The chart recorder is also fairly slow and can be represented by the following first-order differential equation: dx 3 - x(t) = Kva(t) dt where x(t) is the position, K is the chart recorder gain and va(t) is the input driving voltage in mV. The maximum length of paper is 300 mm. (a) Produce a block diagram for the system. (b) If the temperature changes by up to 35 °C, investigate the maximum value of the amplifier gain such that the chart recorder position remains within the boundary of the paper.