Page 1 of 1
Experiment A Haynes-Shockley experiment, with setup shown in Figure 1, was performed on a p-type Germanium sample of len
Posted: Thu May 05, 2022 2:23 pm
by answerhappygod
- Experiment A Haynes Shockley Experiment With Setup Shown In Figure 1 Was Performed On A P Type Germanium Sample Of Len 1 (49.54 KiB) Viewed 60 times
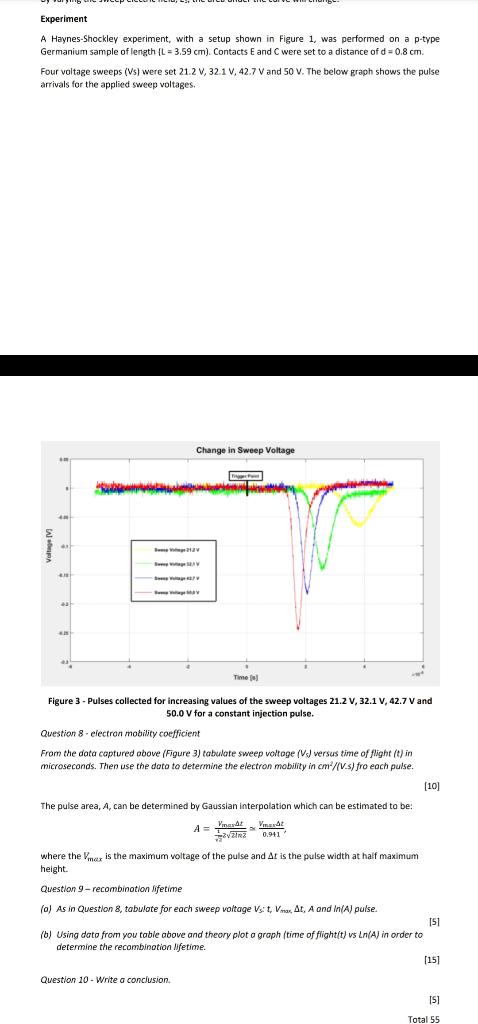
Experiment A Haynes-Shockley experiment, with setup shown in Figure 1, was performed on a p-type Germanium sample of length (L= 3.59 cm). Contacts E and C were set to a distance of d= 0.8 cm. Four voltage sweeps (Vs) were set 21.2 V, 32.1 V, 42.7 V and 50 V. The below graph shows the pulse arrivals for the applied sweep voltages. Change in Sweep Voltage P 21 SAY - Voltage Time ( Figure 3 - Pulses collected for increasing values of the sweep voltages 21.2 V, 32.1 V, 42.7 V and 50.0 V for a constant injection pulse. Question 8 electron mobility coefficient From the data captured above (Figure 3) tabulate sweep voltage (V) versus time of flight (t) in microseconds. Then use the data to determine the electron mobility in cm²/(V-s) fro each pulse. [10] The pulse area, A, can be determined by Gaussian interpolation which can be estimated to be: A= matt 2212 0.941 where the Vmax is the maximum voltage of the pulse and At is the pulse width at half maximum height. Question 9-recombination lifetime (a) As in Question 8, tabulate for each sweep voltage Vs: t, Var, At, A and In(A) pulse. [5] (b) Using dato from you table above and theory plot a graph (time of flight(t) vs Ln(A) in order to determine the recombination lifetime. [15] Question 10 - Write a conclusion. [5] Total 55