Page 1 of 1
Question 33 (1 point) Jeff is creating a Tree Map in Tableau to show daily food sales in a diner. It looks similar to th
Posted: Thu May 05, 2022 1:32 pm
by answerhappygod
- Question 33 1 Point Jeff Is Creating A Tree Map In Tableau To Show Daily Food Sales In A Diner It Looks Similar To Th 1 (40.29 KiB) Viewed 43 times
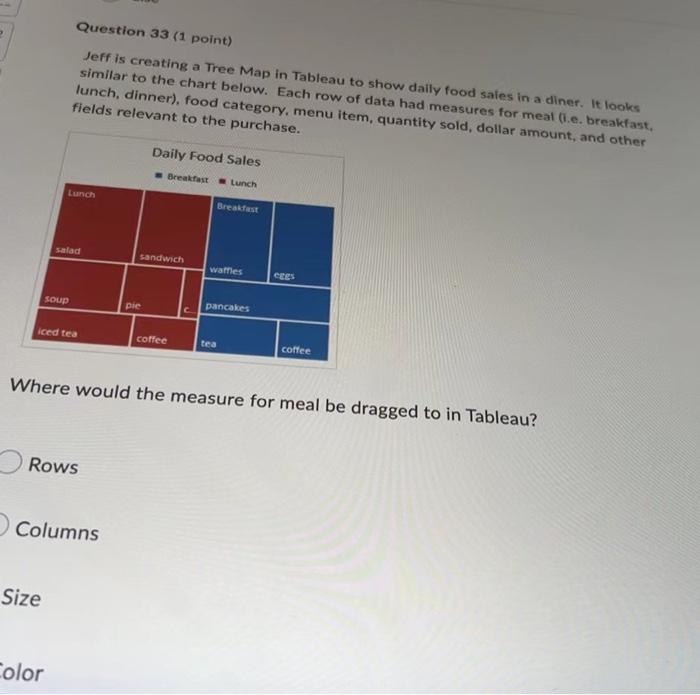
Question 33 (1 point) Jeff is creating a Tree Map in Tableau to show daily food sales in a diner. It looks similar to the chart below. Each row of data had measures for meal (i.e. breakfast, lunch, dinner), food category, menu item, quantity sold, dollar amount, and other fields relevant to the purchase. Daily Food Sales Breakfast Lunch Lunch Breakfast waffles pancakes soup iced tea coffee tea coffee Where would the measure for meal be dragged to in Tableau? Rows Columns Size Color salad sandwich pie