Page 1 of 1
Question 30 The horizontal control data for a route traverse is illustrated in Figure 2 and Table 4. Figure 2: Route Tra
Posted: Thu May 05, 2022 11:59 am
by answerhappygod
- Question 30 The Horizontal Control Data For A Route Traverse Is Illustrated In Figure 2 And Table 4 Figure 2 Route Tra 1 (59.37 KiB) Viewed 40 times
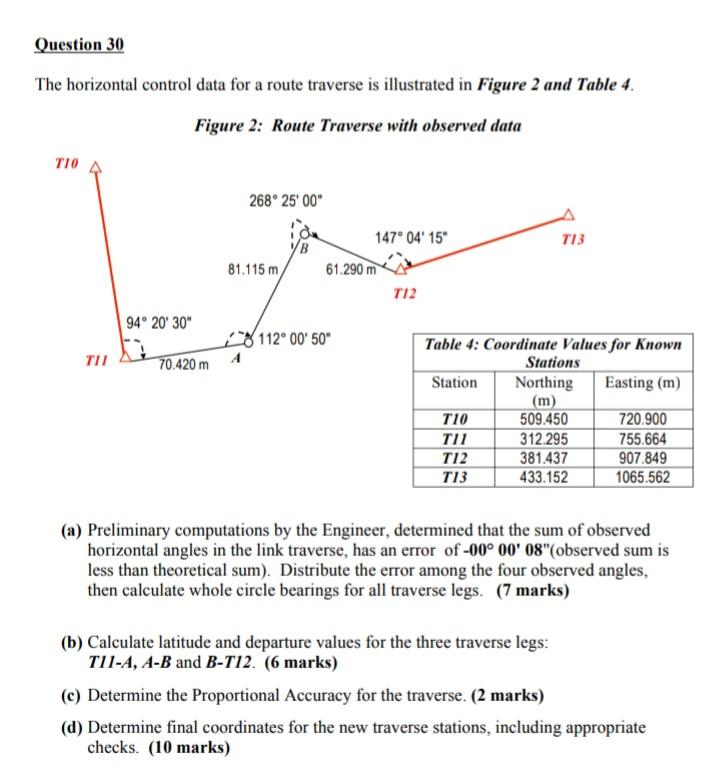
Question 30 The horizontal control data for a route traverse is illustrated in Figure 2 and Table 4. Figure 2: Route Traverse with observed data TIO 268° 25'00" idu 147°04' 15" T13 T12 112° 00'50" Table 4: Coordinate Values for Known TIL 70.420 m Stations Station Northing Easting (m) (m) T10 509.450 720.900 TII 312.295 755.664 T12 381.437 907.849 T13 433.152 1065.562 (a) Preliminary computations by the Engineer, determined that the sum of observed horizontal angles in the link traverse, has an error of -00° 00' 08" (observed sum is less than theoretical sum). Distribute the error among the four observed angles, then calculate whole circle bearings for all traverse legs. (7 marks) (b) Calculate latitude and departure values for the three traverse legs: T11-A, A-B and B-T12. (6 marks) (c) Determine the Proportional Accuracy for the traverse. (2 marks) (d) Determine final coordinates for the new traverse stations, including appropriate checks. (10 marks) 94° 20' 30" 81.115 m/ A 61.290 m