Page 1 of 1
Problem 5. (20 points) The following figure is like figure 10.6 in the test. They both describe the geometry for what is
Posted: Thu May 05, 2022 11:44 am
by answerhappygod
- Problem 5 20 Points The Following Figure Is Like Figure 10 6 In The Test They Both Describe The Geometry For What Is 1 (50.27 KiB) Viewed 39 times
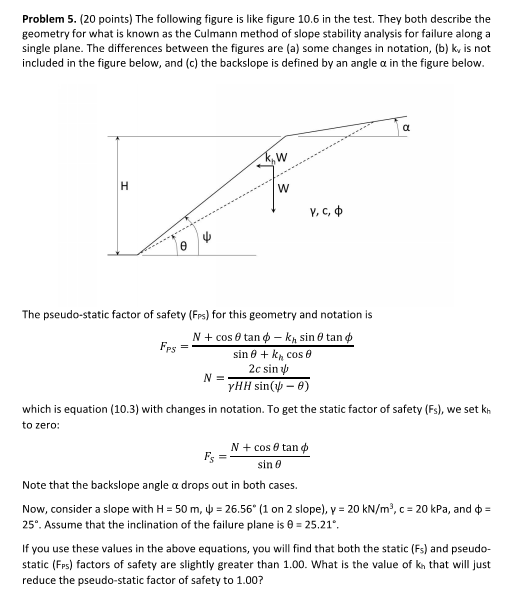
Problem 5. (20 points) The following figure is like figure 10.6 in the test. They both describe the geometry for what is known as the Culmann method of slope stability analysis for failure along a single plane. The differences between the figures are (a) some changes in notation, (b) k, is not included in the figure below, and (c) the backslope is defined by an angle a in the figure below. k₂W H W Y, C, The pseudo-static factor of safety (Frs) for this geometry and notation is Fps N + cos tan-k₂ sin tan sin Ⓒ + kh cos 0 2c sin YHH sin(-0) N = which is equation (10.3) with changes in notation. To get the static factor of safety (Fs), we set kh to zero: Fs N + cos 0 tan sin 0 Note that the backslope angle a drops out in both cases. Now, consider a slope with H = 50 m, 4 = 26.56° (1 on 2 slope), y = 20 kN/m³, c = 20 kPa, and = 25°. Assume that the inclination of the failure plane is 0 = 25.21*. If you use these values in the above equations, you will find that both the static (Fs) and pseudo- static (FPS) factors of safety are slightly greater than 1.00. What is the value of kn, that will just reduce the pseudo-static factor of safety to 1.00?