Page 1 of 1
A department of transportation's study on driving speed and miles per gallon for midsize automobiles resulted in the fol
Posted: Sun Oct 03, 2021 11:05 am
by answerhappygod
- A Department Of Transportation S Study On Driving Speed And Miles Per Gallon For Midsize Automobiles Resulted In The Fol 1 (247.44 KiB) Viewed 145 times
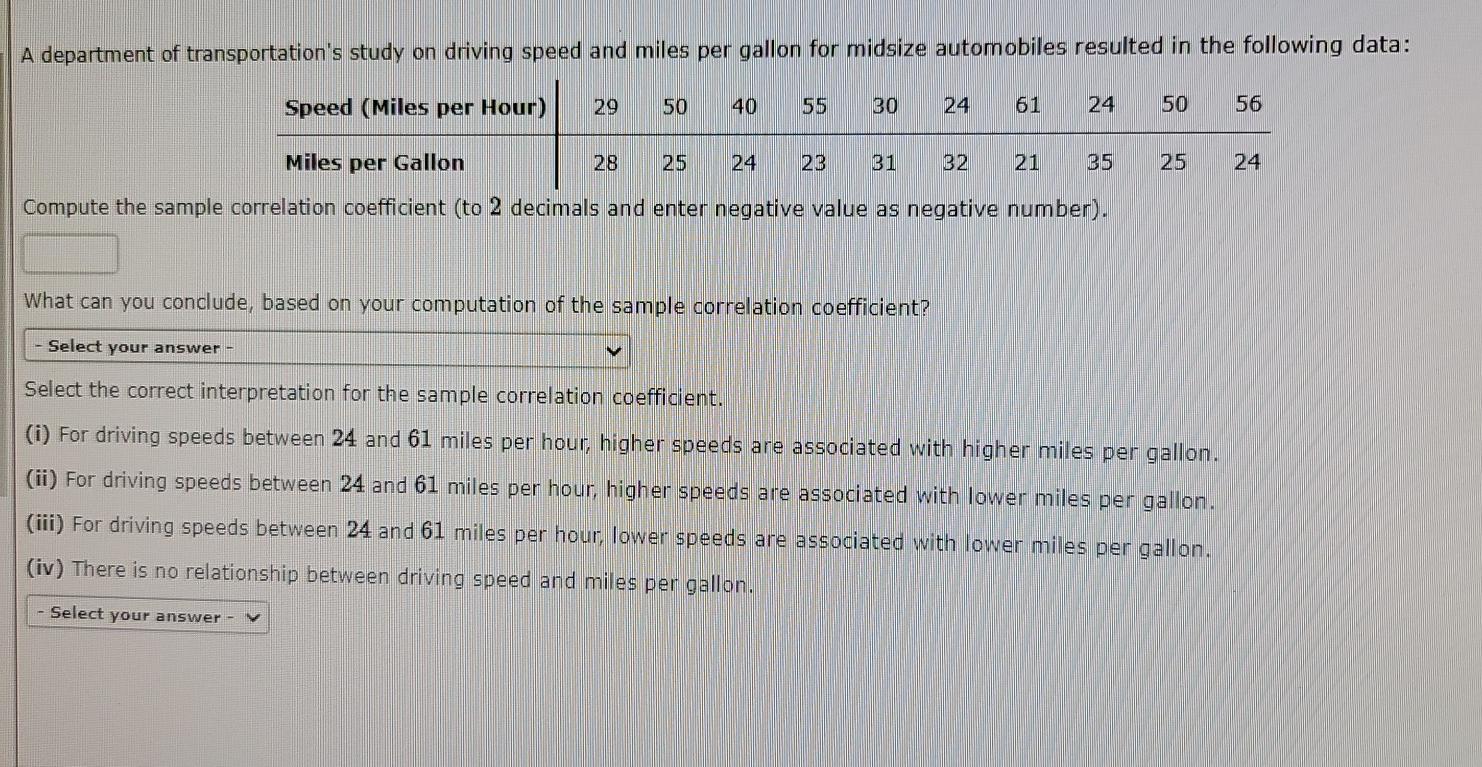
A department of transportation's study on driving speed and miles per gallon for midsize automobiles resulted in the following data: Speed (Miles per Hour) 29 50 40 55 30 24 61 24 50 56 Miles per Gallon 28 25 24 23 31 32 21 25 25 24 Compute the sample correlation coefficient (to 2 decimals and enter negative value as negative number). What can you conclude, based on your computation of the sample correlation coefficient? Select your answer - Select the correct interpretation for the sample correlation coefficient. (i) For driving speeds between 24 and 61 miles per hour, higher speeds are associated with higher miles per gallon. (ii) For driving speeds between 24 and 61 miles per hour, higher speeds are associated with lower miles per gallon. (iii) For driving speeds between 24 and 61 miles per hour, lower speeds are associated with lower miles per gallon. (iv) There is no relationship between driving speed and miles per gallon. - Select your answer