Page 1 of 1
The table below reports the actual inflation rate from 2016 to 2020. Complete the table, assuming people form expectatio
Posted: Thu May 05, 2022 7:41 am
by answerhappygod
- The Table Below Reports The Actual Inflation Rate From 2016 To 2020 Complete The Table Assuming People Form Expectatio 1 (319.4 KiB) Viewed 66 times
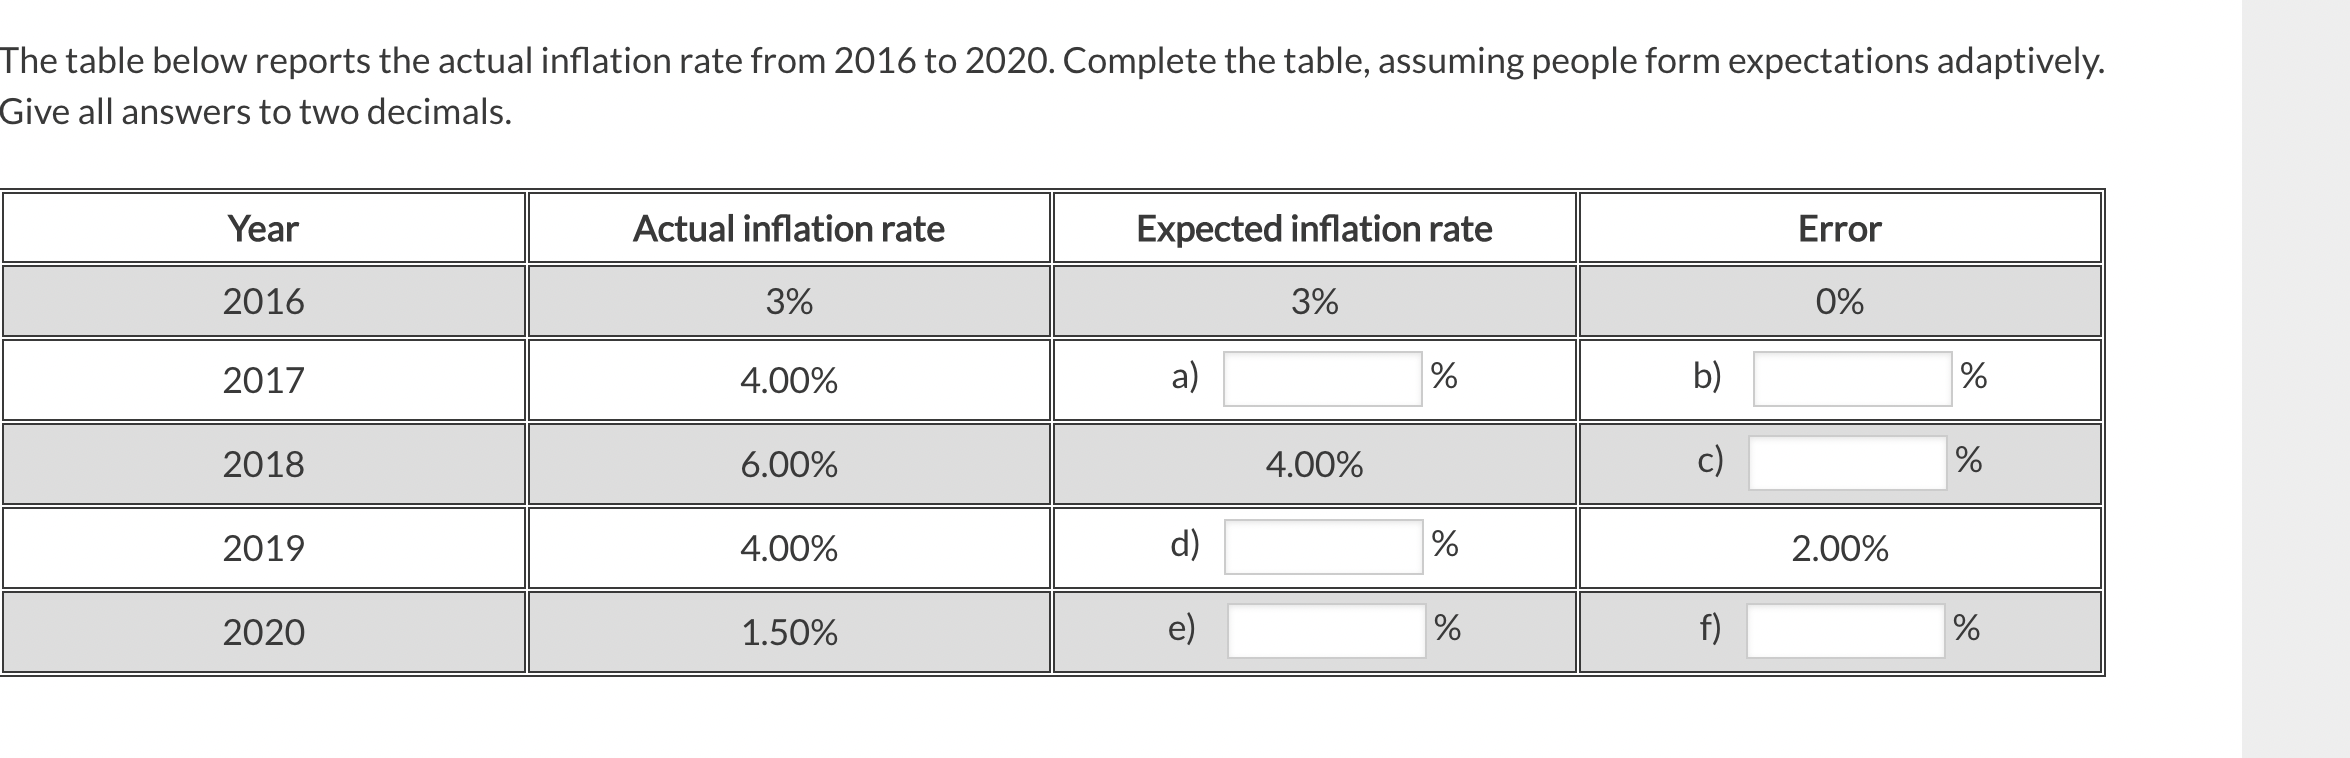
The table below reports the actual inflation rate from 2016 to 2020. Complete the table, assuming people form expectations adaptively. Give all answers to two decimals. Year Actual inflation rate Expected inflation rate Error 0% 2016 3% 3% 2017 4.00% a) % 2018 6.00% 4.00% 2019 4.00% d) 2.00% 2020 1.50% % do % b) c) f) % % %