Page 1 of 1
Price P₁ P3 V W X U Z Y Q₁ Q4 S P₂ D Quantity Q5 Q3 Figure 4 Domestic market for a good Figure 4 shows a country's domes
Posted: Thu May 05, 2022 6:34 am
by answerhappygod
- Price P P3 V W X U Z Y Q Q4 S P D Quantity Q5 Q3 Figure 4 Domestic Market For A Good Figure 4 Shows A Country S Domes 1 (75.68 KiB) Viewed 46 times
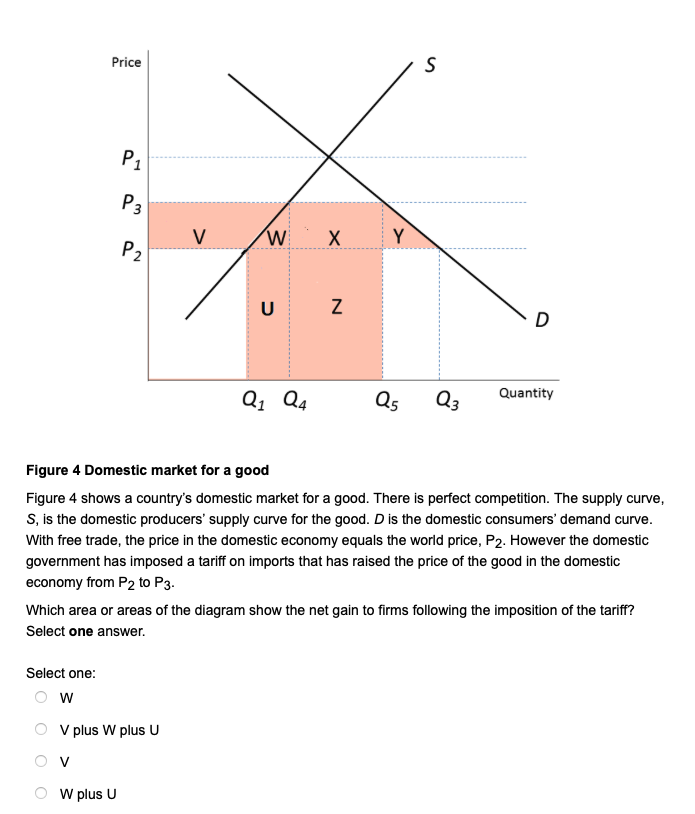
Price P₁ P3 V W X U Z Y Q₁ Q4 S P₂ D Quantity Q5 Q3 Figure 4 Domestic market for a good Figure 4 shows a country's domestic market for a good. There is perfect competition. The supply curve, S, is the domestic producers' supply curve for the good. D is the domestic consumers' demand curve. With free trade, the price in the domestic economy equals the world price, P2. However the domestic government has imposed a tariff on imports that has raised the price of the good in the domestic economy from P2 to P3. Which area or areas of the diagram show the net gain to firms following the imposition of the tariff? Select one answer. Select one: W V plus W plus U W plus U