Page 1 of 1
Final income 45° Original Income Figure 6: Welfare policy diagram Towards the right of Figure 6 are two circular red mar
Posted: Thu May 05, 2022 6:33 am
by answerhappygod
- Final Income 45 Original Income Figure 6 Welfare Policy Diagram Towards The Right Of Figure 6 Are Two Circular Red Mar 1 (44.55 KiB) Viewed 32 times
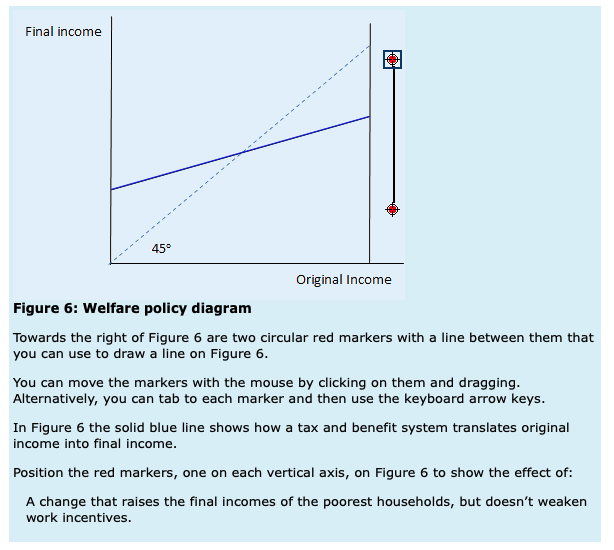
Final income 45° Original Income Figure 6: Welfare policy diagram Towards the right of Figure 6 are two circular red markers with a line between them that you can use to draw a line on Figure 6. You can move the markers with the mouse by clicking on them and dragging. Alternatively, you can tab to each marker and then use the keyboard arrow keys. In Figure 6 the solid blue line shows how a tax and benefit system translates original income into final income. Position the red markers, one on each vertical axis, on Figure 6 to show the effect of: A change that raises the final incomes of the poorest households, but doesn't weaken work incentives.