- 2006 2007 2008 2009 2010 2011 2012 2013 293 436 310 871 316 323 307 111 325 306 338 215 341 016 349 647 2 2 035 4 303 0 1 (244.08 KiB) Viewed 40 times
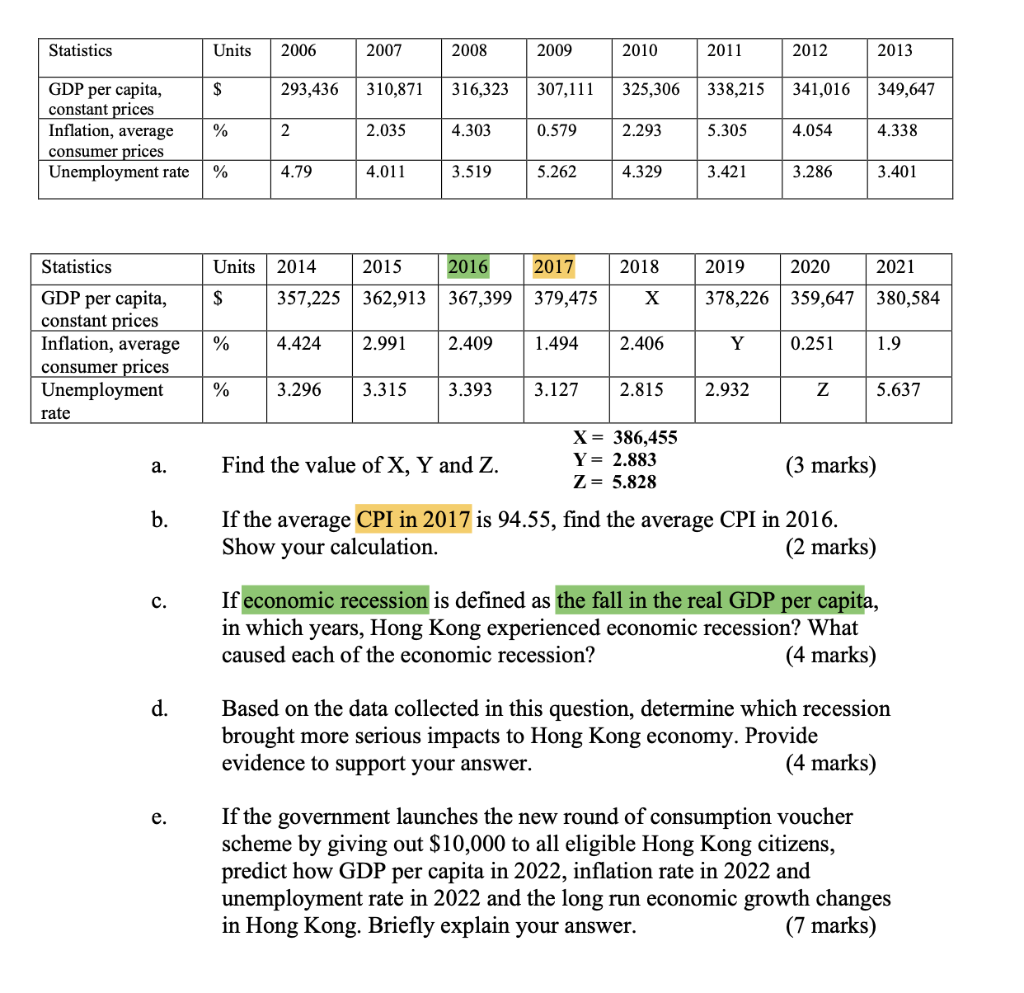
2006 2007 2008 2009 2010 2011 2012 2013 293,436 310,871 316,323 307,111 325,306 338,215 341,016 349,647 2 2.035 4.303 0.579 2.293 5.305 4.054 4.338 4.79 4.011 3.519 5.262 4.329 3.421 3.286 3.401 Units 2014 2016 2017 2018 2019 2020 2021 2015 357,225 362,913 367,399 379,475 X 378,226 359,647 380,584 $ % 4.424 2.991 2.409 1.494 2.406 Y 0.251 1.9 % 3.296 3.315 3.393 3.127 2.815 2.932 Z 5.637 X = 386,455 Y = 2.883 Find the value of X, Y and Z. (3 marks) Z= 5.828 If the average CPI in 2017 is 94.55, find the average CPI in 2016. Show your calculation. (2 marks) If economic recession is defined as the fall in the real GDP per capita, in which years, Hong Kong experienced economic recession? What caused each of the economic recession? (4 marks) Based on the data collected in this question, determine which recession brought more serious impacts to Hong Kong economy. Provide evidence to support your answer. (4 marks) If the government launches the new round of consumption voucher scheme by giving out $10,000 to all eligible Hong Kong citizens, predict how GDP per capita in 2022, inflation rate in 2022 and unemployment rate in 2022 and the long run economic growth changes in Hong Kong. Briefly explain your answer. (7 marks) Statistics Units $ GDP per capita, constant prices Inflation, average consumer prices % Unemployment rate % Statistics GDP per capita, constant prices Inflation, average consumer prices Unemployment rate a. b. C. d. e.