- The Balance Sheets For Plasma Screens Corporation And Additional Information Are Provided Below Plasma Screens Corporat 1 (50.79 KiB) Viewed 43 times
- The Balance Sheets For Plasma Screens Corporation And Additional Information Are Provided Below Plasma Screens Corporat 2 (30.05 KiB) Viewed 43 times
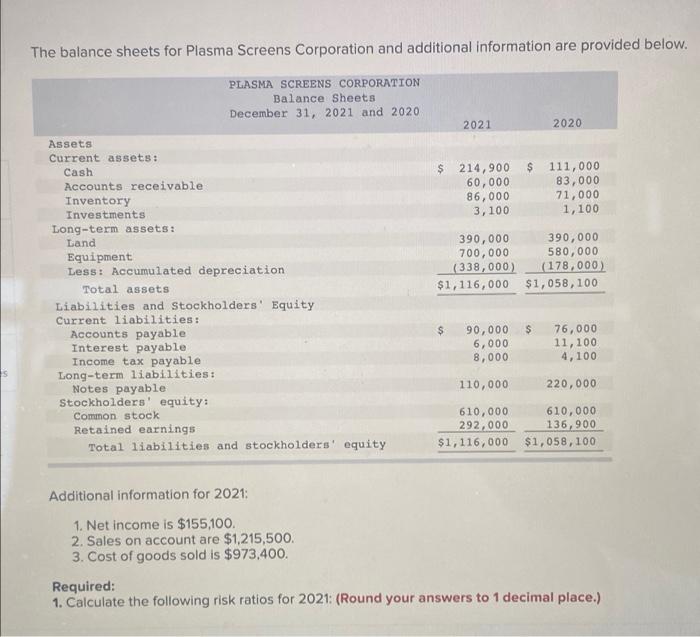
The balance sheets for Plasma Screens Corporation and additional information are provided below. PLASMA SCREENS CORPORATION Balance Sheets December 31, 2021 and 2020 2021 2020 Assets Current assets: Cash. $ 214,900 $ 111,000 Accounts receivable 60,000 83,000 Inventory 86,000 71,000 Investments 3,100 1,100 Long-term assets: Land 390,000 390,000 Equipment 700,000 580,000 Less: Accumulated depreciation (338,000) (178,000) Total assets $1,116,000 $1,058,100 Liabilities and Stockholders' Equity Current liabilities: $ 90,000 $ 76,000 Accounts payable Interest payable Income tax payable 6,000 8,000 11,100 4,100 Long-term liabilities: 110,000 220,000 Notes payable Stockholders' equity: Common stock 610,000 610,000 Retained earnings 292,000 136,900 Total liabilities and stockholders' equity $1,116,000 $1,058,100 Additional information for 2021: 1. Net income is $155,100. 2. Sales on account are $1,215,500. 3. Cost of goods sold is $973,400. Required: 1. Calculate the following risk ratios for 2021: (Round your answers to 1 decimal place.)
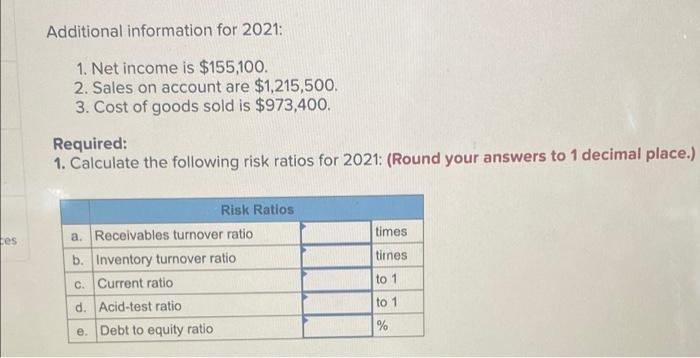
Additional information for 2021: 1. Net income is $155,100. 2. Sales on account are $1,215,500. 3. Cost of goods sold is $973,400. Required: 1. Calculate the following risk ratios for 2021: (Round your answers to 1 decimal place.) Risk Ratios a. Receivables turnover ratio tes times b. Inventory turnover ratio. tirnes c. Current ratio to 1 d. Acid-test ratio to 1 e. Debt to equity ratio %