- Bsta450 Final Exam Teacher Salim Lahmiri 17 June 2020 From 14h45 To 16h45 Analysis Of Maximum Likelihood Estimates 1 (165.71 KiB) Viewed 47 times
- Bsta450 Final Exam Teacher Salim Lahmiri 17 June 2020 From 14h45 To 16h45 Analysis Of Maximum Likelihood Estimates 2 (80.58 KiB) Viewed 47 times
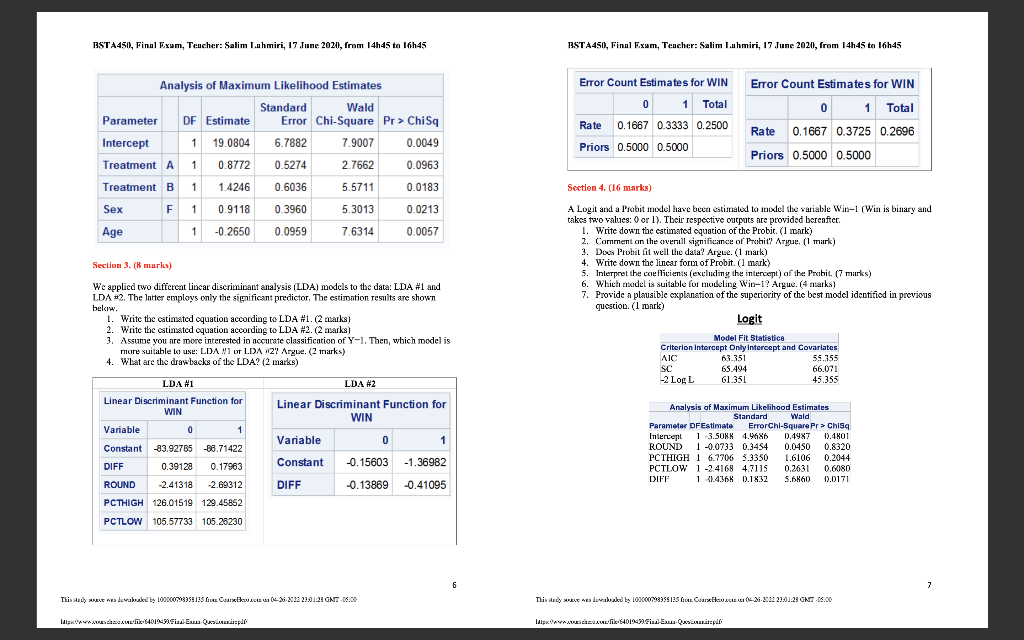
BSTA450, Final Exam, Teacher: Salim Lahmiri, 17 June 2020, from 14h45 to 16h45 Analysis of Maximum Likelihood Estimates Standard Wald Parameter DF Estimate Error Chi-Square Pr > ChiSq 6.7882 7.9007 0.0049 Intercept 1 19.0804 Treatment A 1 0.8772 0.5274 2.7662 0.0963 Treatment B 1 1.4246 0.6036 5.5711 0.0183 Sex F 1 0.9118 0.3960 5.3013 0.0213 Age 1 -0.2650 0.0959 7.6314 0.0057 Section 3. (8 marks) We applied two different linear discriminant analysis (LDA) models to the data: LDA #1 and LDA #2. The latter employs only the significant predictor. The estimation results are shown below. 1. Write the estimated equation according to LDA #1. (2 marks) 2. Write the estimated equation according to LDA #2. (2 marks) 3. Assume you are more interested in accurate classification of Y-1. Then, which model is more suitable to use: LDA #1 or LDA #27 Argue. (2 marks) 4. What are the drawbacks of the LDA? (2 marks) LDA #1 LDA #2 Linear Discriminant Function for WIN Linear Discriminant Function for WIN Variable 0 1 1 Constant -83.92785 -86.71422 DIFF 0.17963 0.39128 ROUND -2.41318 -2.69312 PCTHIGH 126.01519 129.45852 PCTLOW 105.57733 105.26230 Variable Constant DIFF 0 -0.15603 -1.36982 -0.13869 -0.41095 This study was lowakaked by 100000798358135 from CounsE. 06-26-2022 23.01.23 GMT-05:00 www.who.com:lik-54019439 Final-Esses-Questionnisepif 6 BSTA450, Final Exam, Teacher: Salim Lahmiri, 17 June 2020, from 14h45 to 16h45 Error Count Estimates for WIN 0 1 Total Rate 0.1667 0.3333 0.2500 Priors 0.5000 0.5000 Error Count Estimates for WIN 0 1 Total Rate 0.1667 0.3725 0.2696 Priors 0.5000 0.5000 Section 4. (16 marks) A Logit and a Probit model have been estimated to model the variable Win-1 (Win is binary and takes two values: 0 or 1). Their respective outputs are provided bereafter. 1. Write down the estimated equation of the Probit. (1 mark) 2. Comment on the overall significance of Probit? Argue. (1 mark) 3. Does Probit fit well the data? Argue. (1 mark) 4. Write down the linear form of Probit. (1 mark) 5. Interpret the coefficients (excluding the intercept) of the Probit. (7 marks) 6. Which model is suitable for modeling Win-1? Argue. (4 marks) 7. Provide a plausible explanation of the superiority of the best model identified in previous question. (1 mark) Logit Model Fit Statistics Criterion Intercept Only Intercept and Covarlates AIC 63.351 55.355 SC 65.494 66.071 -2 Log L 61.351 45.355 Analysis of Maximum Likelihood Estimates Standard Wald ErrorChi-Square Pr > ChiSq Parameter DFEstimate 1 -3.5088 4.9686 Intercept 0.4987 0.4801 ROUND 1 -0.0733 0.3454 0.0450 0.8320 PCTHIGH 16.7706 5.3350 1.6106 0.2044 PCTLOW 1-2.4168 4.7115 0.2631 0.6080 DIFF 1 -0.4368 0.1832 5.6860 0.0171 This study was lowakoaked by 100000798355135 from Coax. 06-26-2022-23:01:23 GMT -06:00
www.schw.xomlik-54019439Fizal-Exsus-Questionamirspil 7
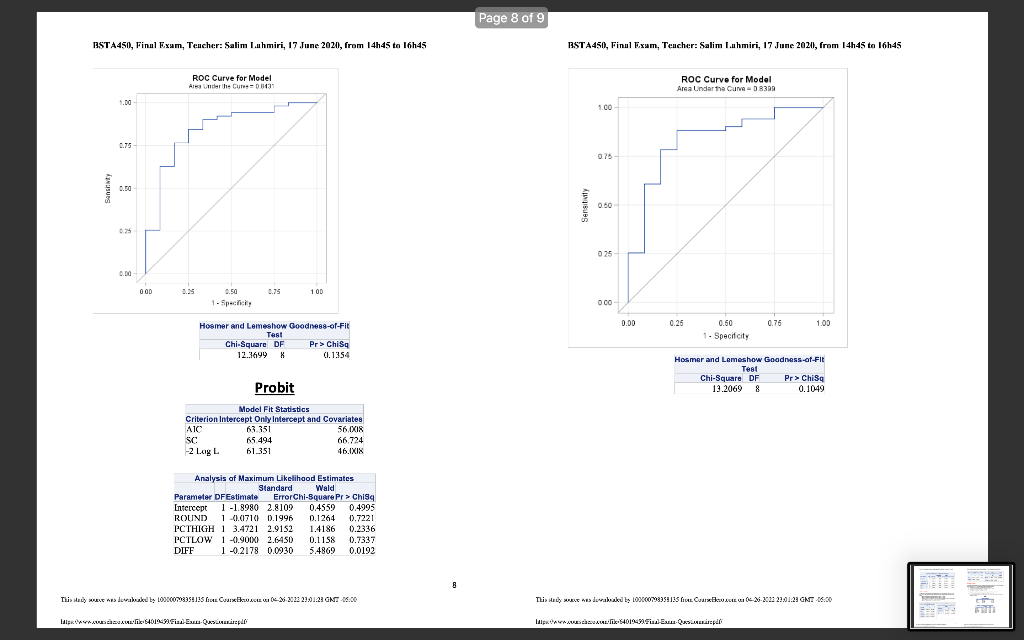
BSTA450, Final Exam, Teacher: Salim Lahmiri, 17 June 2020, from 14h45 to 16h45 ROC Curve for Model Area Under the Cure 08431 1.00- 0.75 0.50 0.25 0.00- 0.75 100 0.50 1-Specificity Hosmer and Lemeshow Goodness-of-Fit Test Chi-Square DF Pr>ChiSq 0.1354 12.3699 8 Probit Model Fit Statistics Criterion Intercept Only Intercept and Covariates AIC 63.351 56.008 SC 65.494 66.724 -2 Log L 61.351 46.1X18 Analysis of Maximum Likelihood Estimates Standard Wald Parameter DFEstimate Error Chi-Square Pr > Chisq Intercept 1-1.8980 2.8109 04559 0.4995 ROUND 1 -0.0710 0.1996 0.1264 0.7221 PCTHIGH 1 3.4721 2.9152 PCTLOW 1-0.9000 2.6450 DIFF 1 -0.2178 1.4186 0.2336 0.1158 0.7337 0.0930 5.4869 0.0192 This study was dewakaled by 100000798358135 from Couro. 06-26-2022 23.01.23 GMT-05:00
www.wik¹54019499 Fizal Exsus-Qasipil OOD 0.25 8 Page 8 of 9 BSTA450, Final Exam, Teacher: Salim Lahmiri, 17 June 2020, from 14h45 to 16h45 ROC Curve for Model Area Under the Curve - 0.8399 1.00- 0.75 0.50 025 0.00- 0.25 0.50 0.75 1.00 1- Specificity Hosmer and Lemeshow Goodness-of-Fit Test Chi-Square DF Pr ChiSq 13.2069 8 0.1049 This study was lowakaked by 100000798355135 from Coax. 06-26-2022-23:01:23 GMT -06:00
www.schw.xomlik-54019439Fizal-Exsus-Questionamirspil 0.00 3722 on Fam